Sociotope.me is a WebGL experiment and an interactive
data visualization for digital identities. Using motion as a metaphor for relevance, Sociotope allows you to grasp,
explore and play with the data left in social networks and the reactions to that data.
Sociotope visualizes the suspense between information being shared in social networks and its relevance to the public.
We’re being overwhelmed by the masses of information being exchanged within social networks and it has become pretty
hard to reproduce the huge amounts of data we tend to make public. Also, does »public« mean that anybody consumes the
information we reveal at all?
Being on the cusp between avatar, interactive toy and data visualization, Sociotope is an experimental way of trying to
bring that data and its relevance to life.

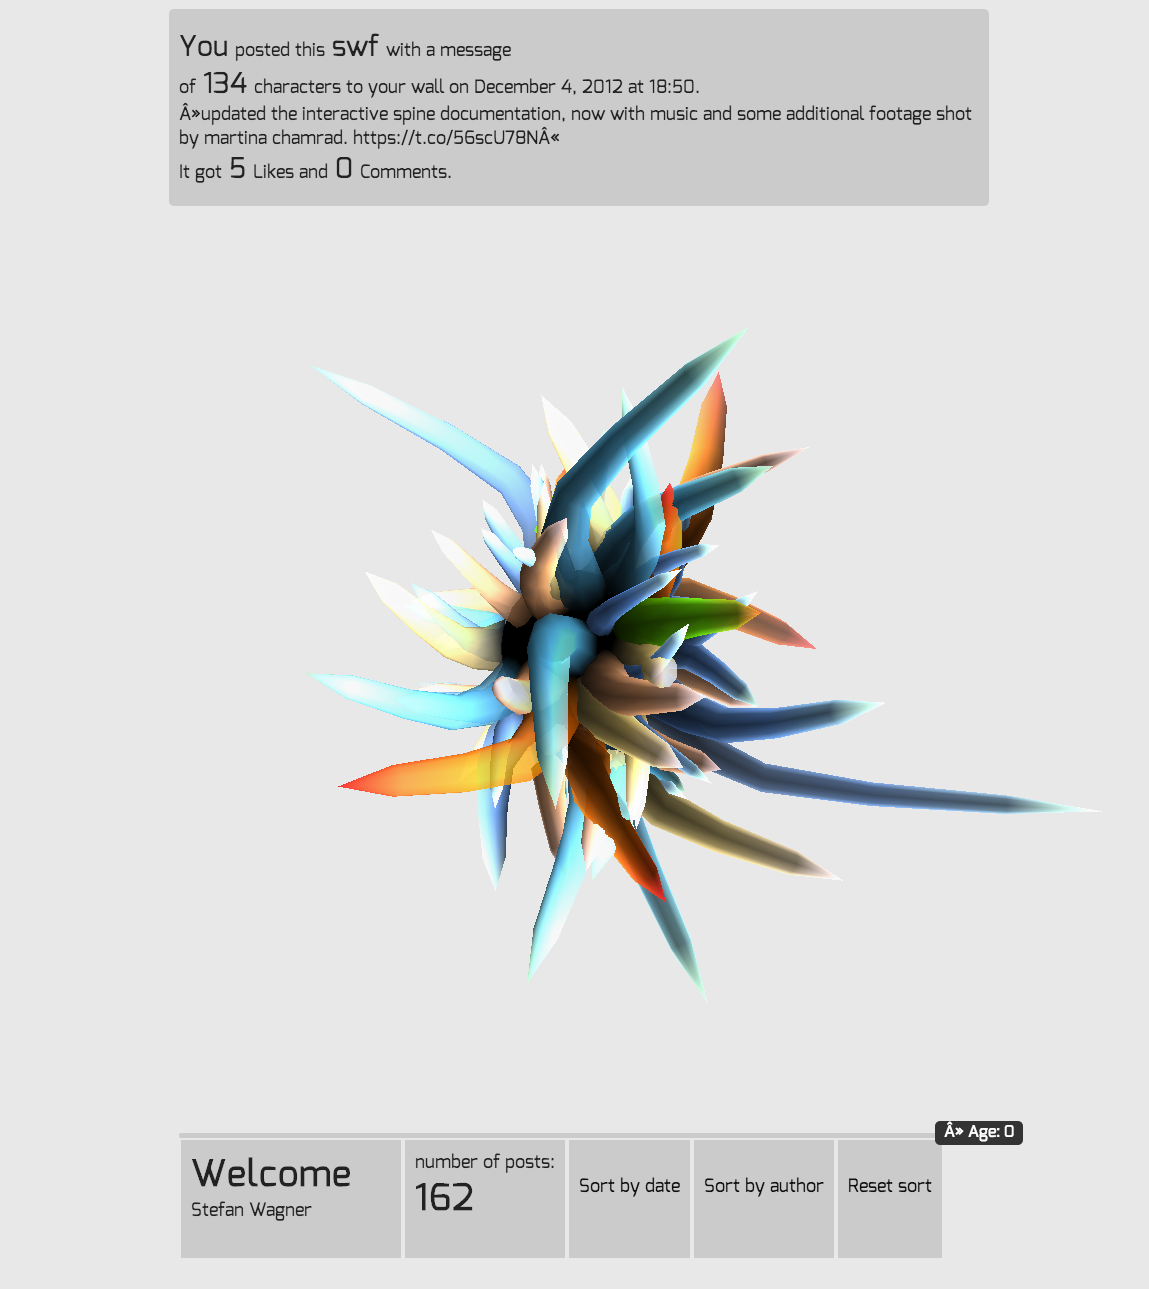
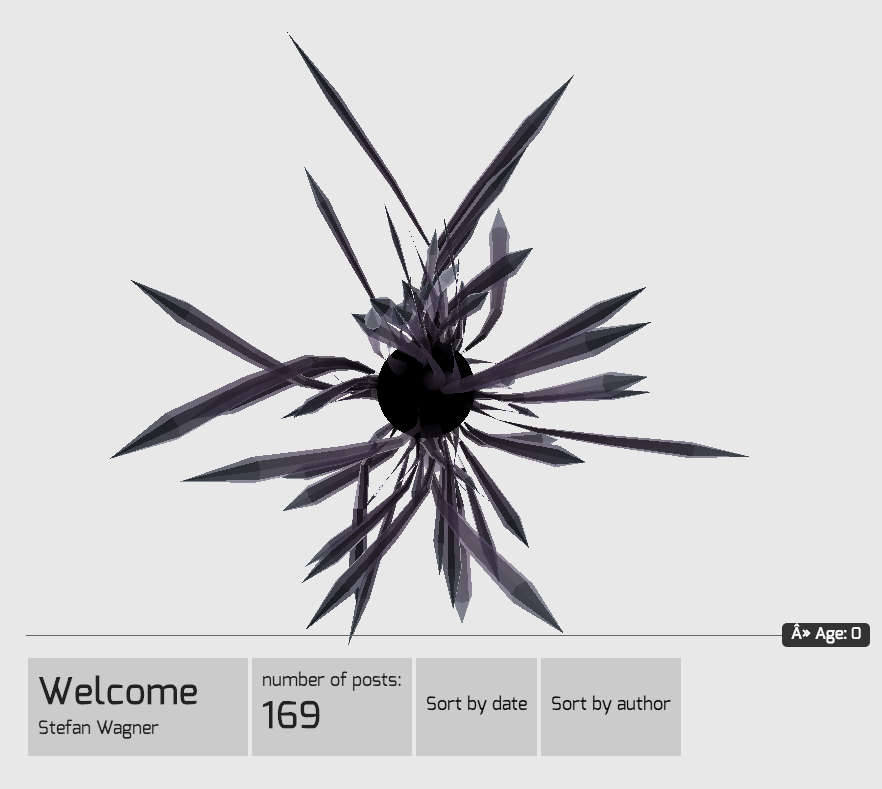
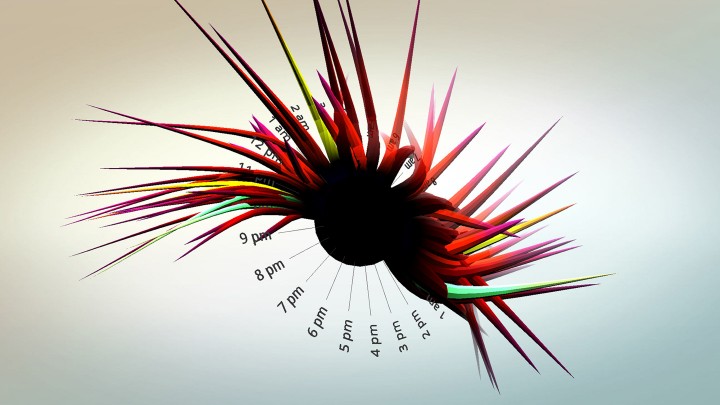
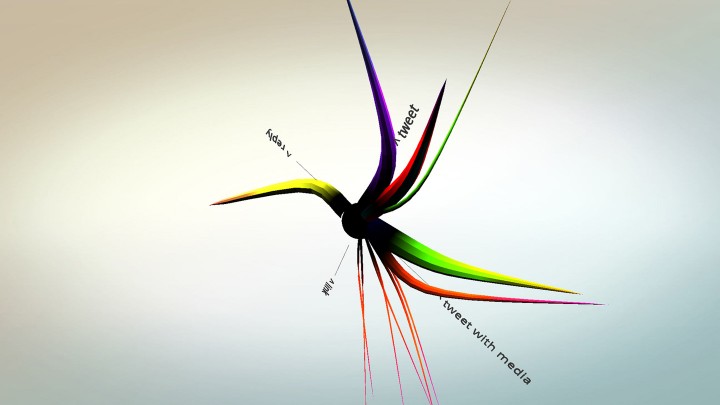
The interactive application builds »data creatures« from the sum of an online identity’s actions within a social
network. This might be a user, a page or even a hashtag. Every tentacle relates to one post / tweet / public activity of
this identity. The more reactions the activity has got (comments, likes, retweets), the stronger the movement of its
tentacle will be.
Every aspect of the object’s appearance can be decoded to the properties of the identity they’re originating from – from
the color of your profile picture to the length of the posts you make.
The resulting objects can be sorted by time of day, author and information type, and by using a slider, you can go back
in time and watch the digital identity’s evolution as its data creature slowly grows.
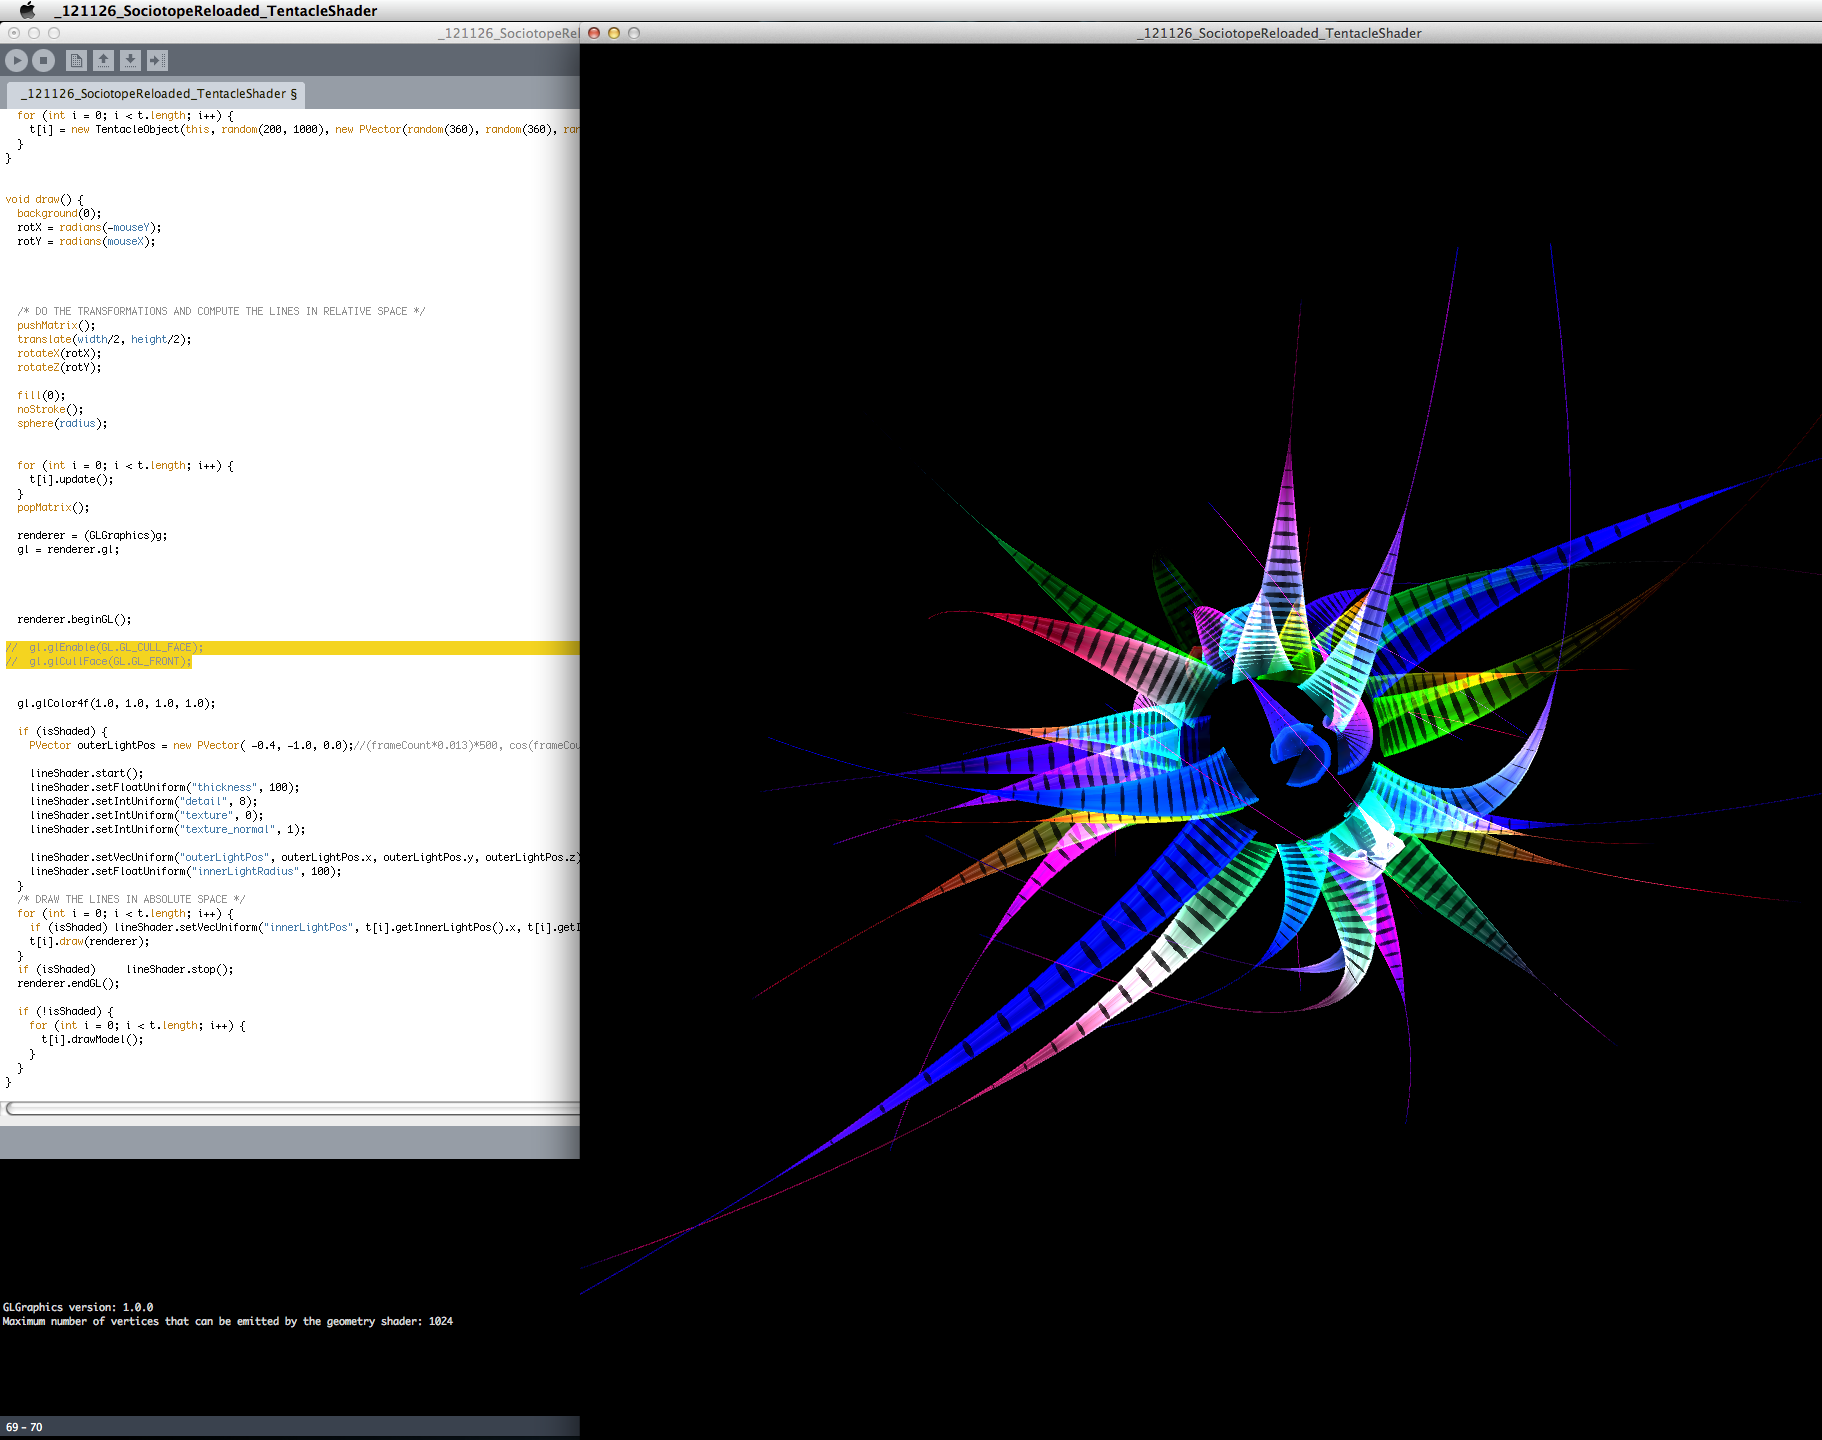
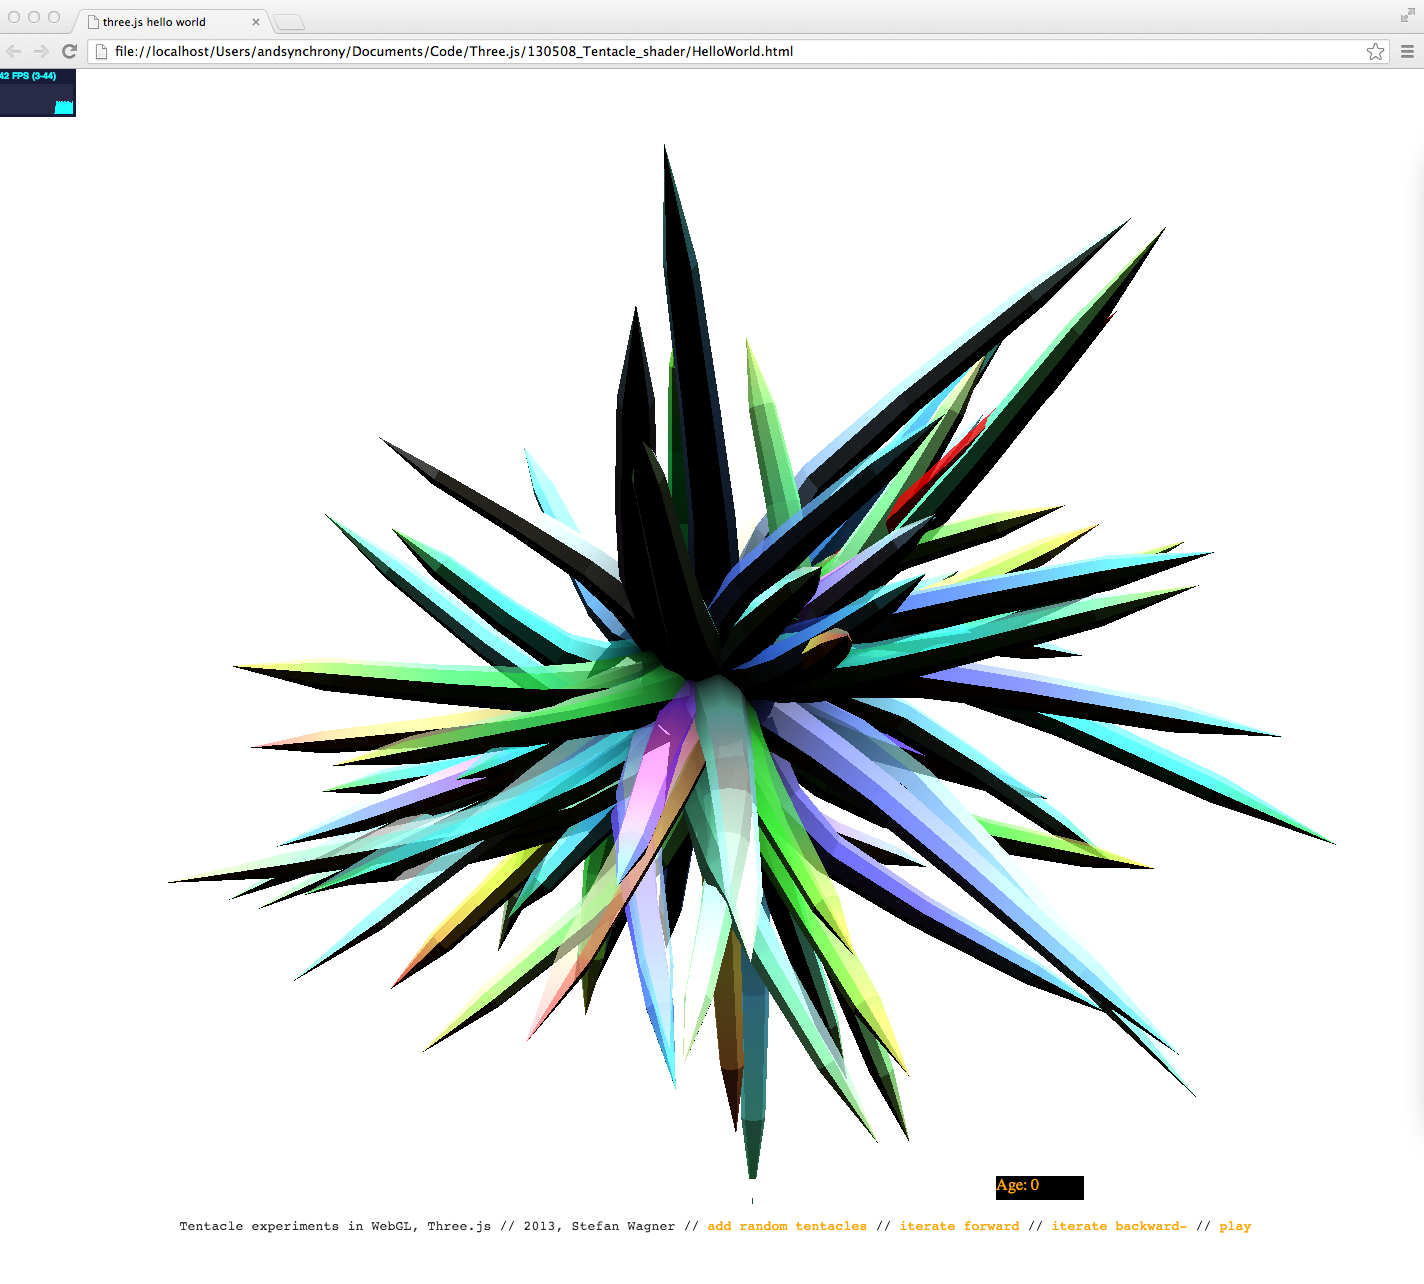
Once started as a semester project prototyped using
the Processing language, I have completely redesigned and rewritten Sociotope from scratch, turning it into a WebGL
application.

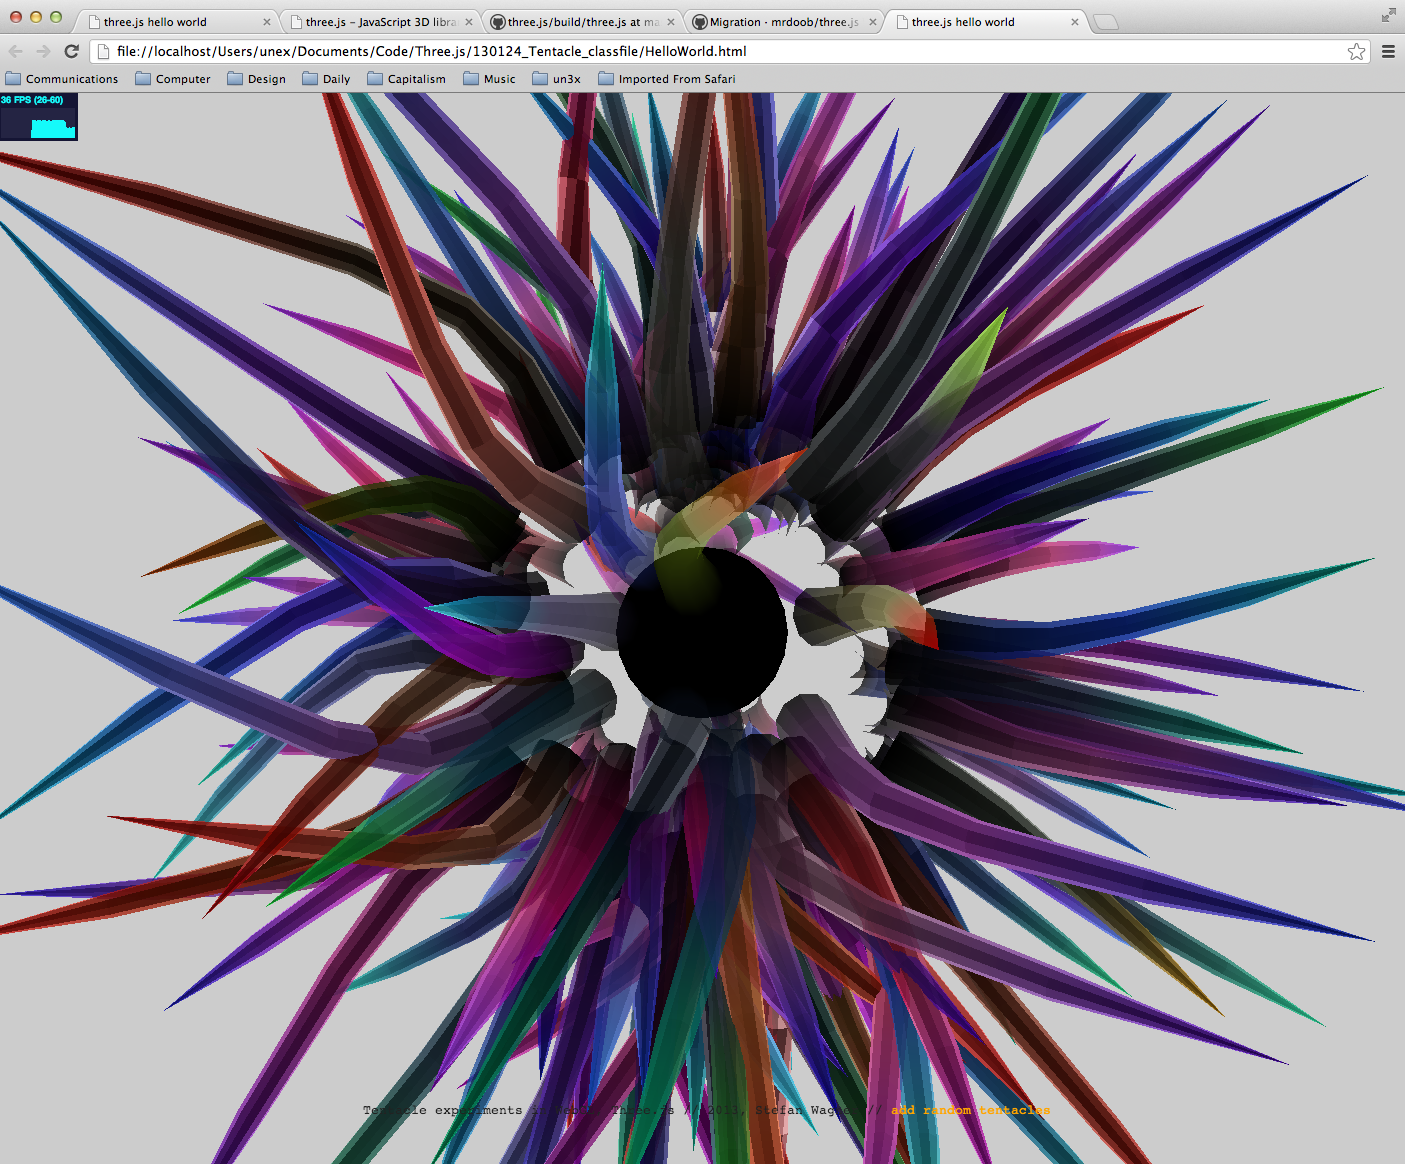
Making of
For allowing to draw the tentacles – masses of geometry which is being updated every frame – in a more or less fast
manner, a custom glsl shader with fixed lighting was written. A lot of tweaking went into the shape of the tentacles,
delivering information about post length, age, relevance and post type. Here you can see the evolving graphics over the
2 years (spare time) the project was made in.