»Generating Utopia« is a realtime visualization of social location data, made with Processing. Its aim is
to show what human habitats could look like if it was possible to transform them depending on the location-based
behavior of their residents.
Although current discussions might indicate otherwise, the pictures we draw of ourselves within todays’ social media
channels are no reliable representations of who we are in real life. We select what others get to see from our reality,
and mostly, we share and publicly like only what considerably leaves a good impression on the rest of the world. We
build an utopia, telling the story of what we think our lives should look like. This conclusion is all the more
inspiring, regarding the fact that social networks begin to expand into physical space: we’re not only telling what
we are up to, but also where we are.
»Generating Utopia« tries to make those individual utopias visible and shows, what human environments could look like if
it was possible to transform them depending on location-based information of their inhabitants. The data was taken from
various users of the social platform »Foursquare«.


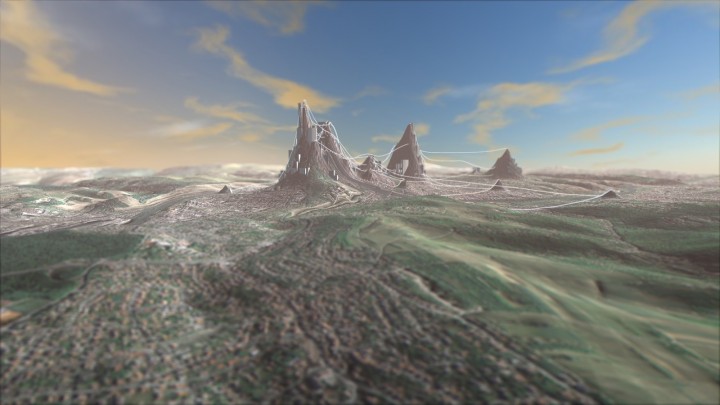
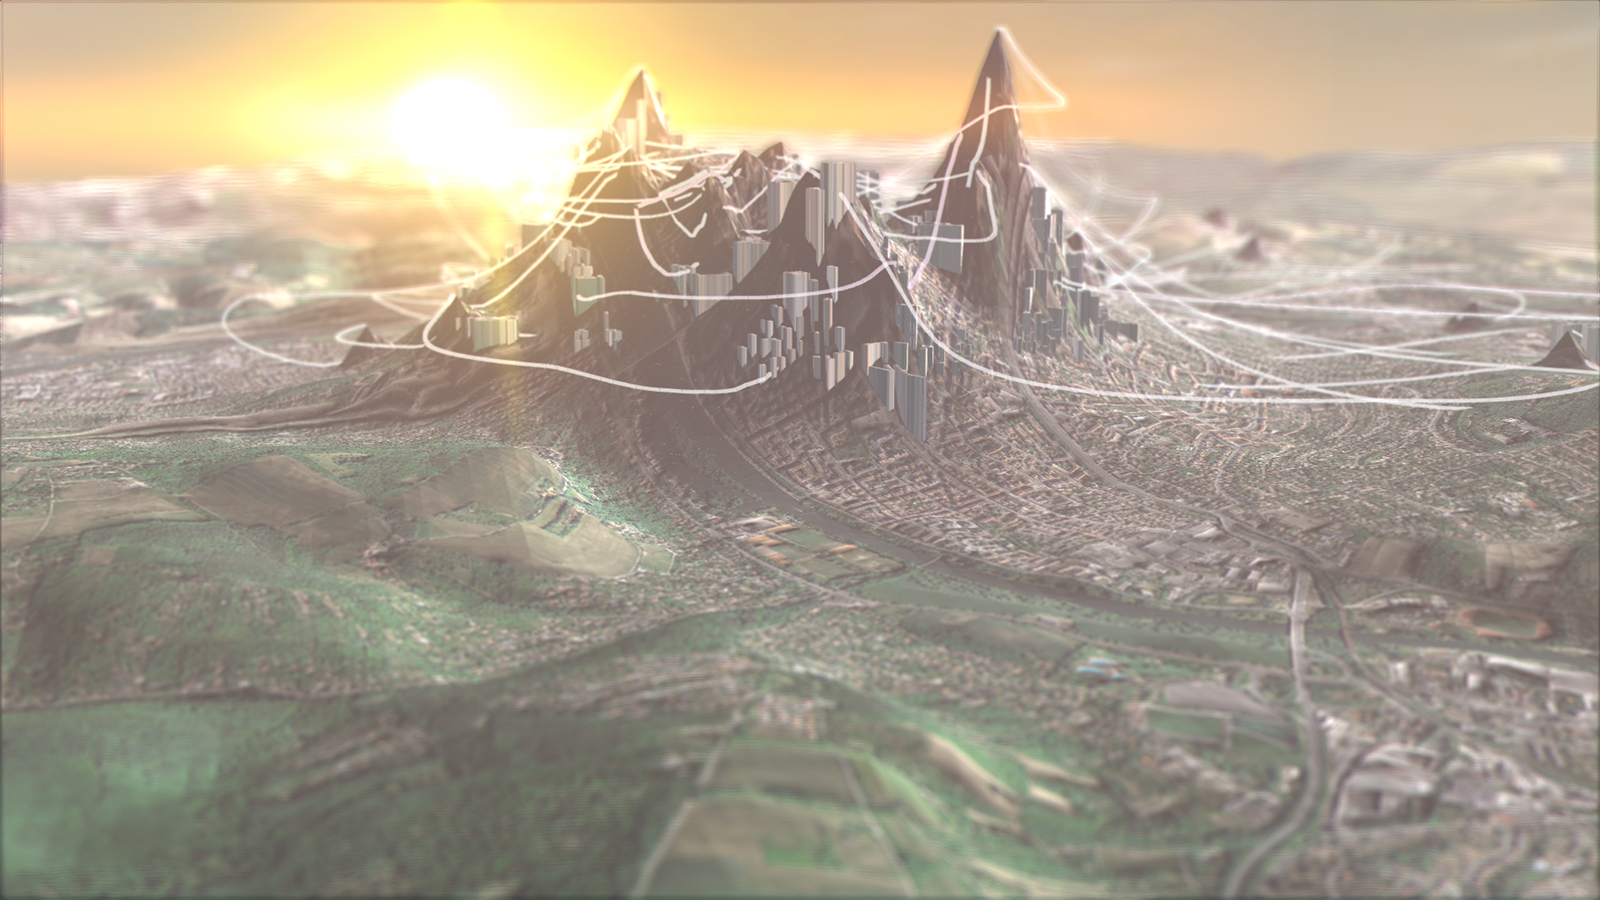
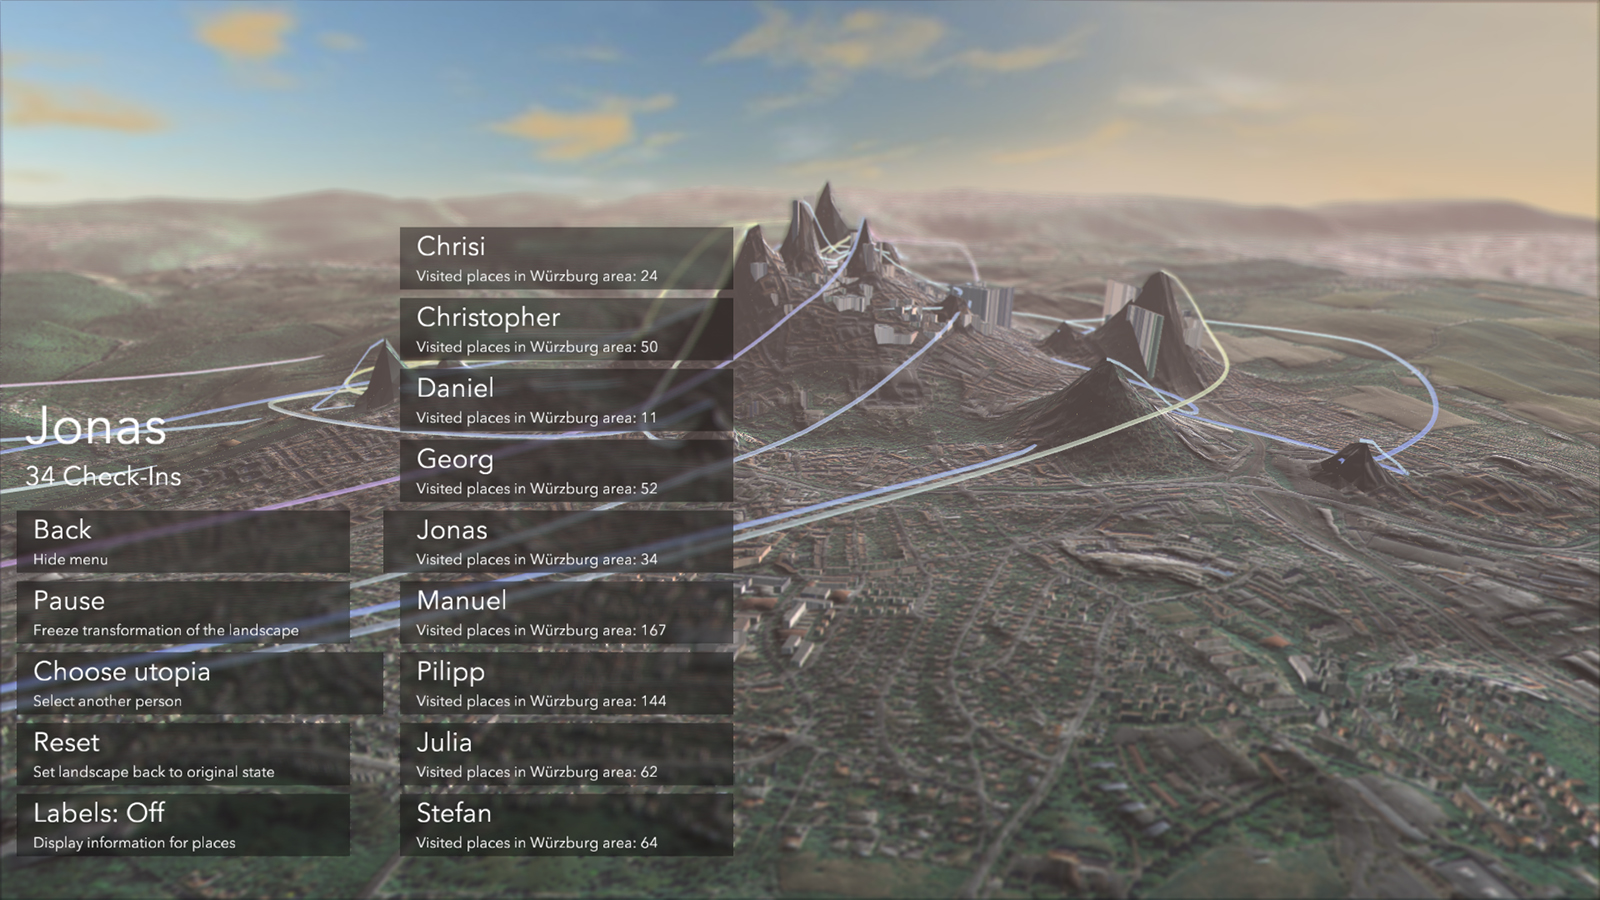
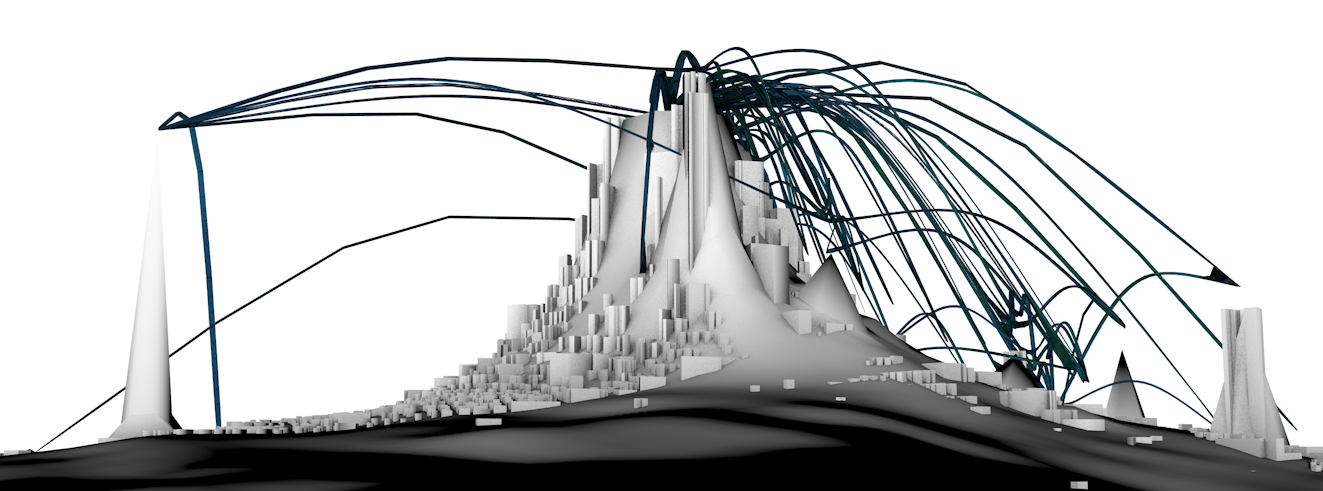
The realtime application starts with an airplane view on an existing city in its current topology. By selecting a
dataset from one of its inhabitants, the city will morph into something else, growing mountains and tubes exactly at
those places, where the person checked in with their Foursquare account. From this, one can see in what different ways
persons are »using« their city – respectively what they want their social environment to think they do. A utopian (or
dystopian) version of the cityscape begins to grow from the ground. The city seen in the footage is a middle-sized
German town called Würzburg.
The application, which was made using the Processing programming environment, generates the imagery in realtime and is
completely interactive. One of its key features is that the major part of the visualizations are generated
programmatically from data available online. For example, the buildings are downloaded from the openstreetmaps.org API
as outlines, translated into 3d models and rendered at their according places. This makes it possible to visualize every
possible place on earth just by changing the geocoordinates and adding datasets for that place. There was no custom
modeling involved.
The project was created during the first semester of my master studies at FH Würzburg, Faculty of Design; supervising
professors were Prof. Erich Schöls and Prof. Gerhard Schweppenhäuser.
Data sources:
- Foursquare.com API – user data for
visualizing Check-in behavior - Openstreetmap.org – getting building
information for generating 3d-buildings - Bayerische Vermessungsverwaltung – www.geodaten.bayern.de – satellite imagery for creating the ground and building textures
Visuals
Inspired by utopian urban planning projects since 1920 and science-fiction concept art from the 20th century,
»Generating Utopia« wants to make a more vibrant approach to the field of data visualization – We don’t share exact
to-the-minute updates from our lives in social media. Consequently, focus is put on drawing pictures that leave room for
interpretation as well as imagination rather than an exact mapping of given information.
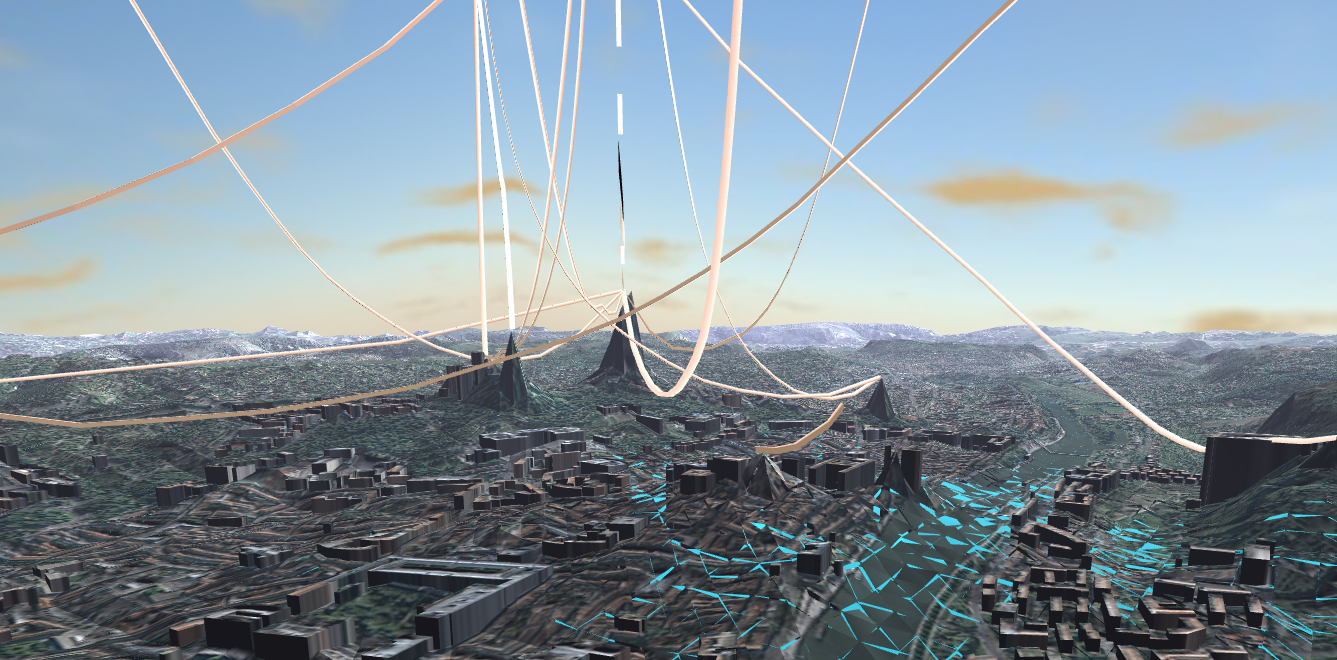
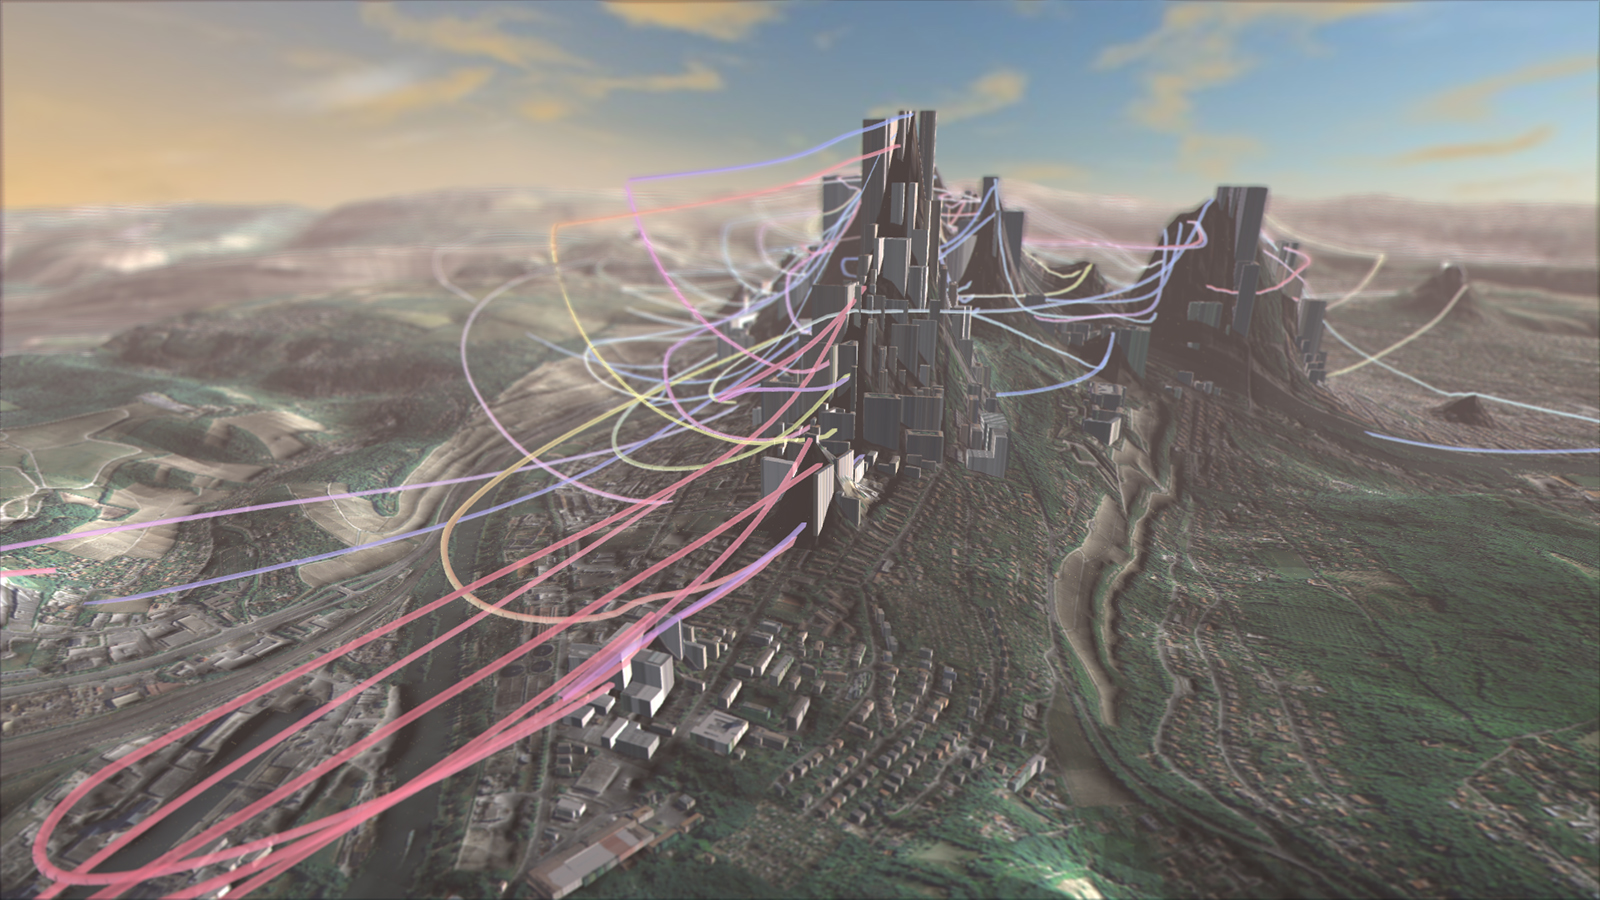
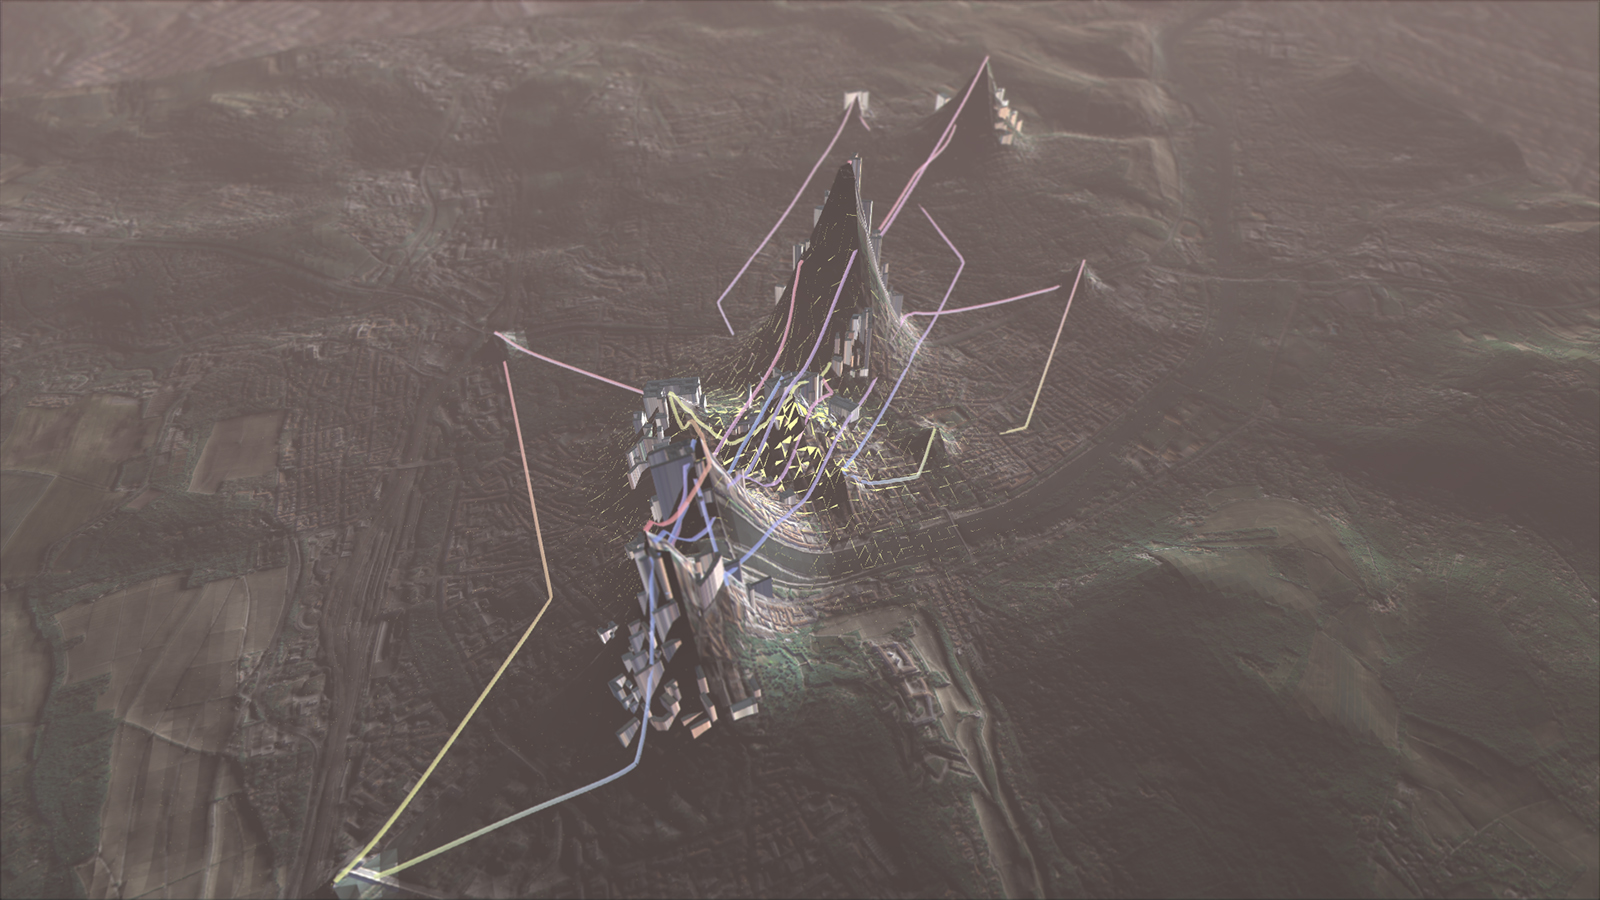
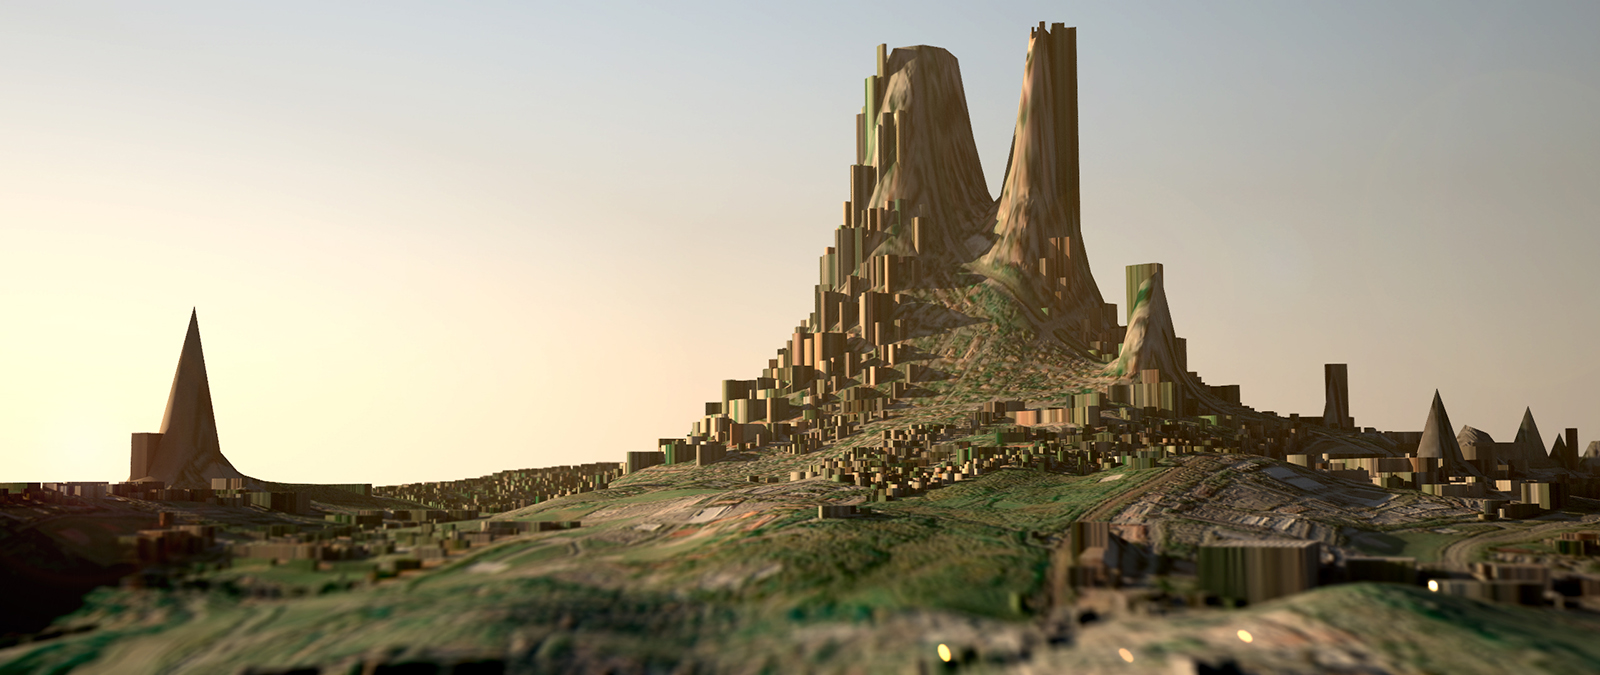
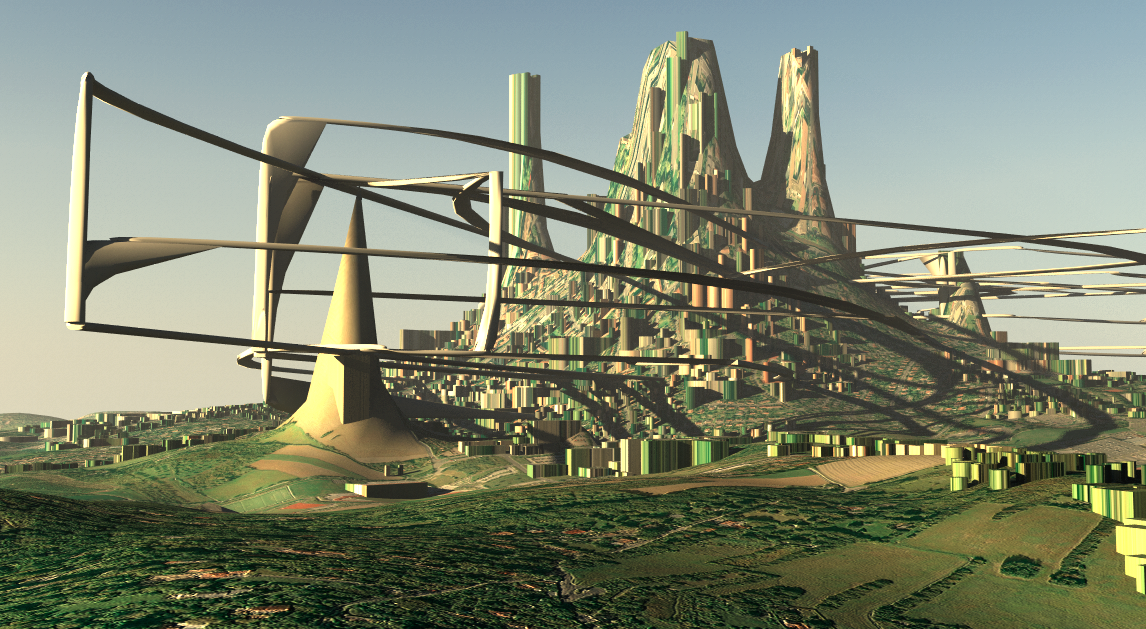
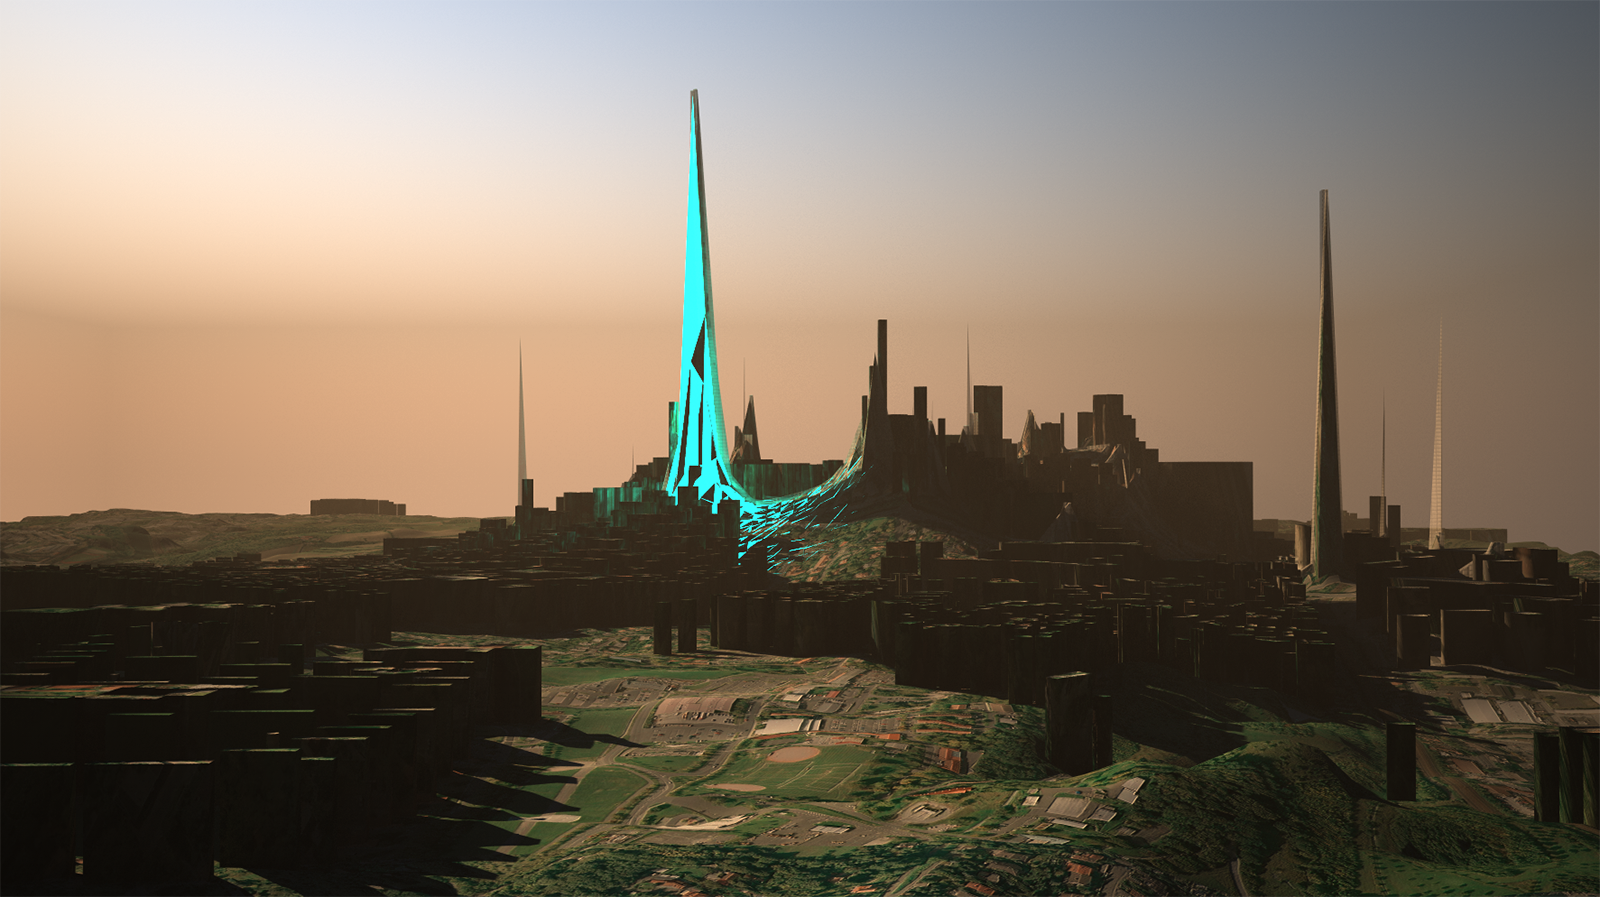
While the use of atmospheric lighting, soft shading and depth-of-field aims at achieving a picturesque, drawing-like
look of the landscape, the data visualization itself is pretty decent – the colorful growing tubes are not further
defined, yet they might be a hint at how transportation might look like in a utopian future: they might be light rails
for self-driving vehicles, or Futurama-like tubes for transporting people with air pressure – the interpretation is up
to the viewer. Basically, they are the visual representation of a virtual web the user has drawn in the city with the
data he left.
Data visualization
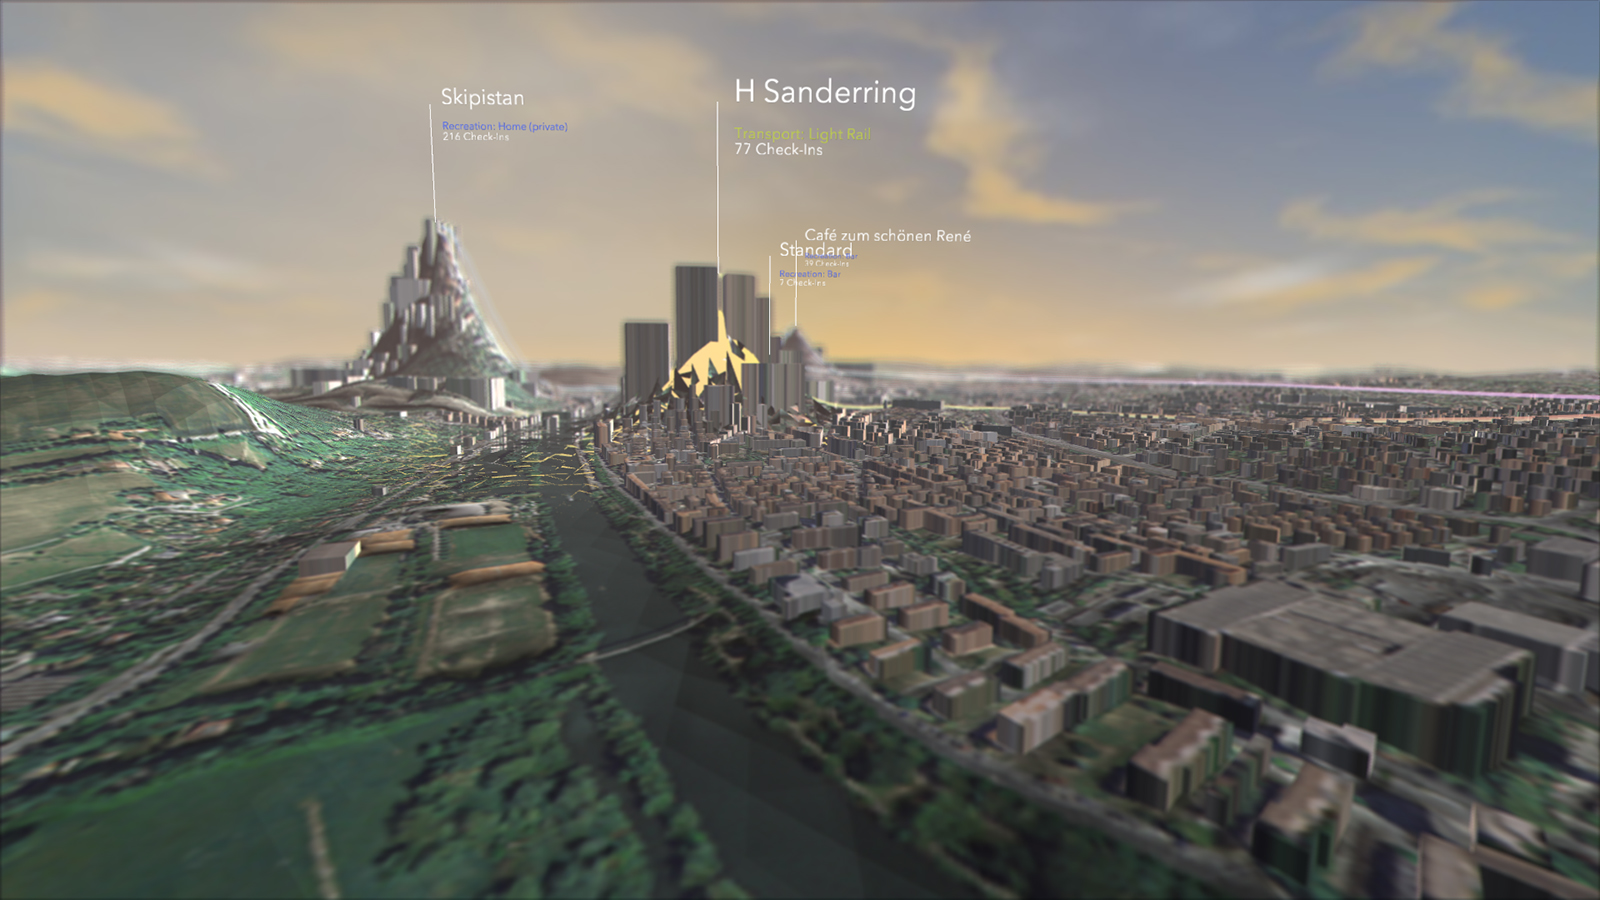
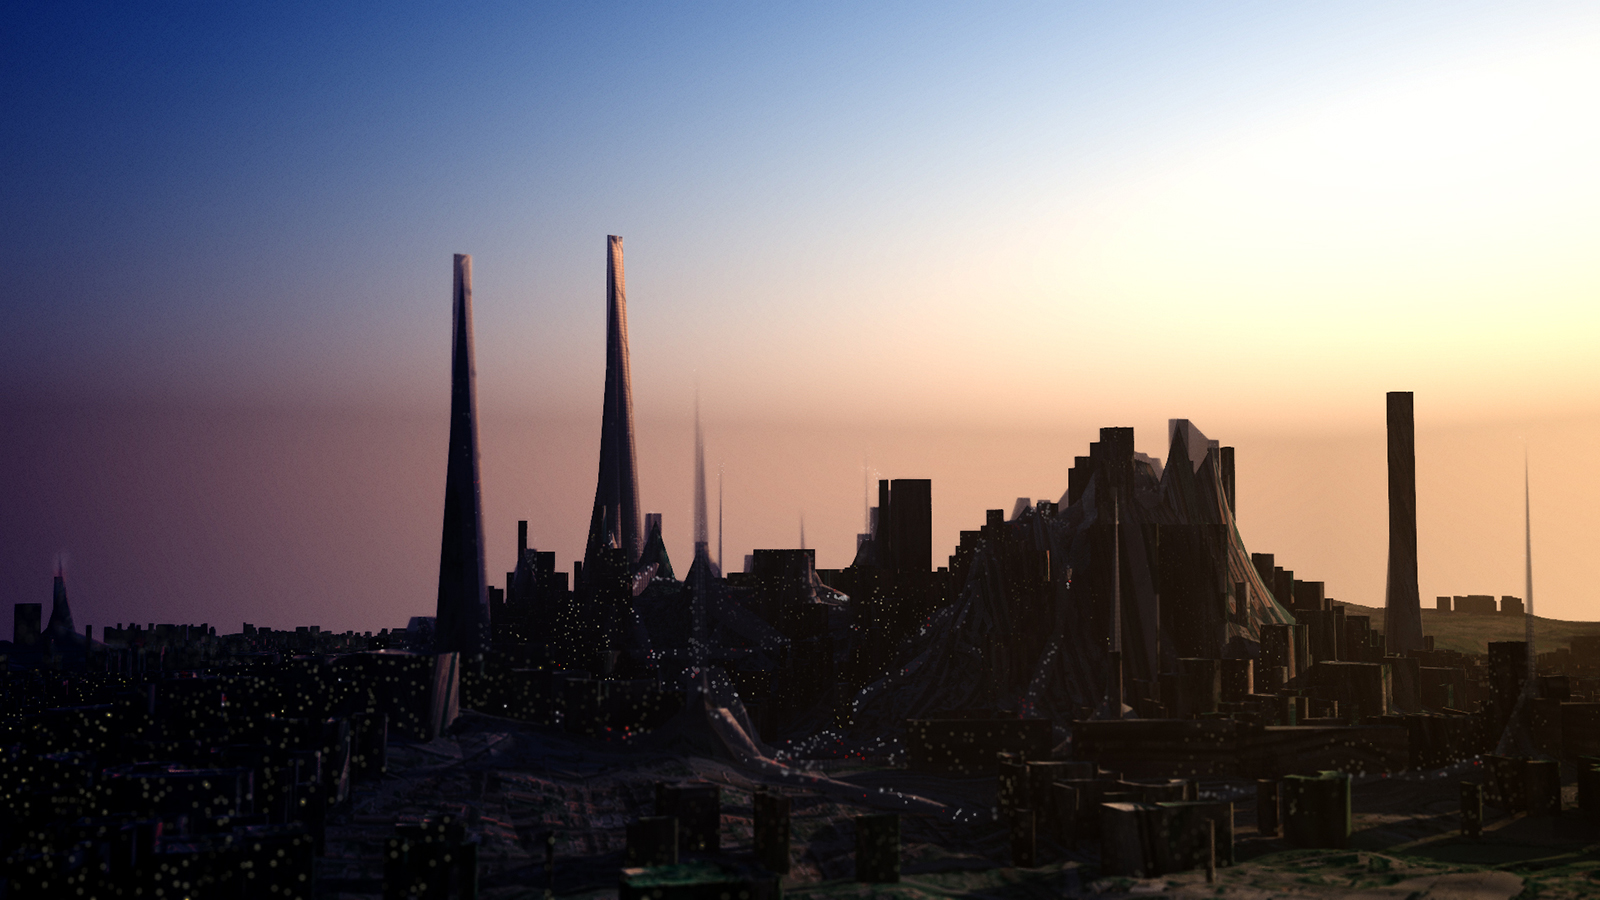
The height of the mountains hints at how frequently a person has visited the according places. Much effort was put into
the algorithm deciding how tall a mountain will be, as the number of Check-Ins differs heavily from venue to venue and
from user to user. When a specific area has many places with few checkins, the hole district will elevate, but it gets
more disrupted than it would be with a single, “big” checkin.
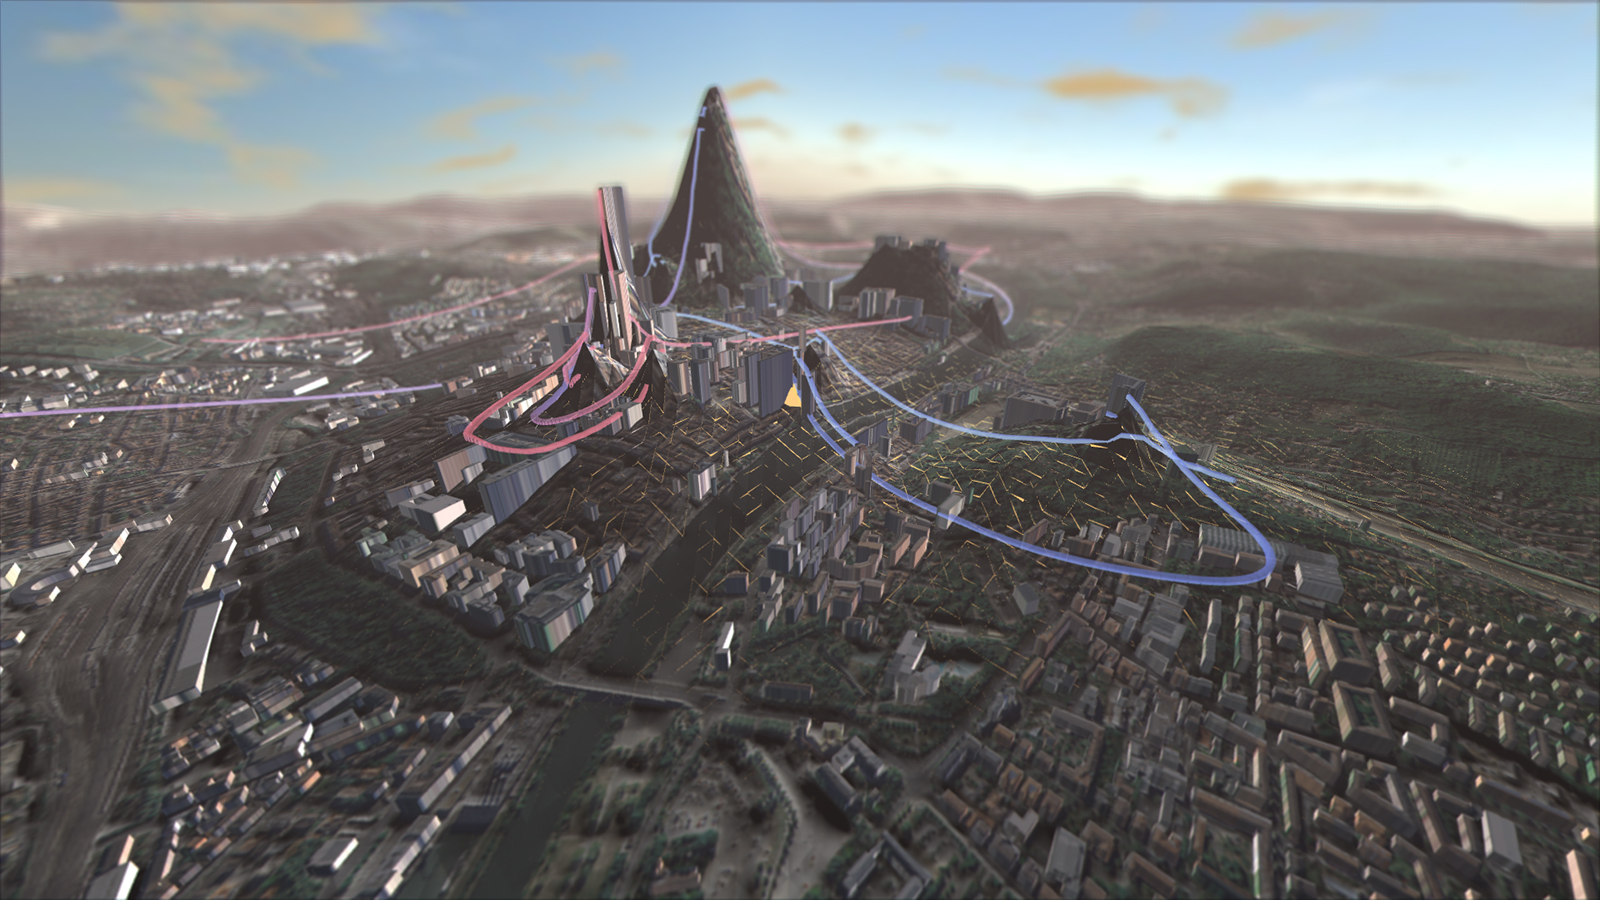
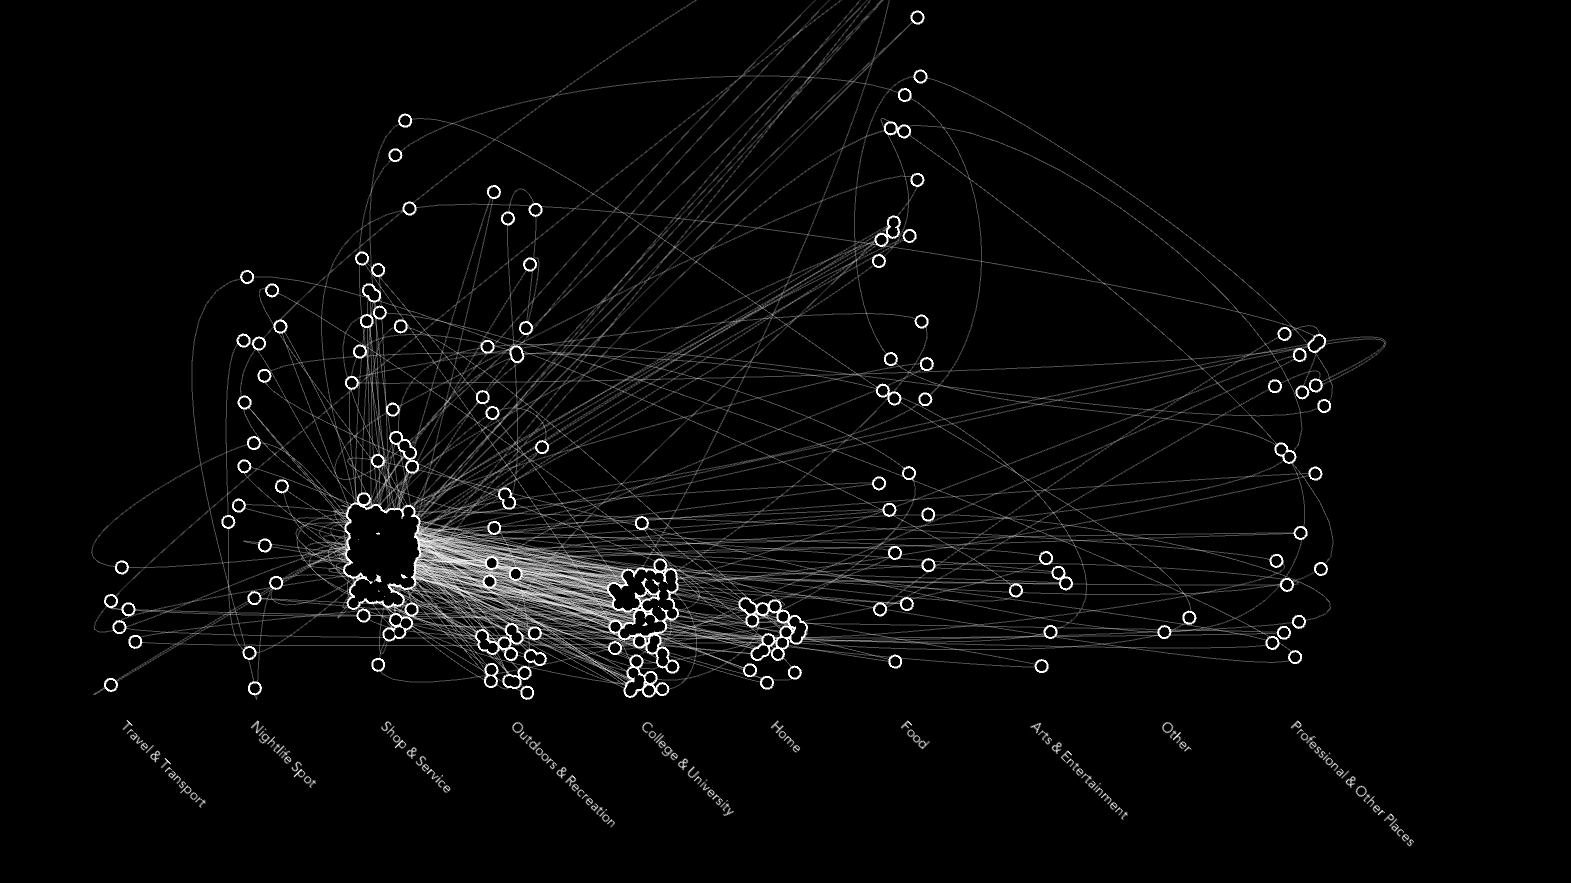
In order to make the growing web more readable and the links easy to distinguish, they are drawn in three different
colors, each representing an attribute as to how the place is most commonly used. For getting the three groups, the
existing 9 categories from Foursquare were thematically reduced to their basic functions: work (red), reacreation (blue)
and transport (yellow). From this, people can get a quick overview on the users behavior without having to read much
information.
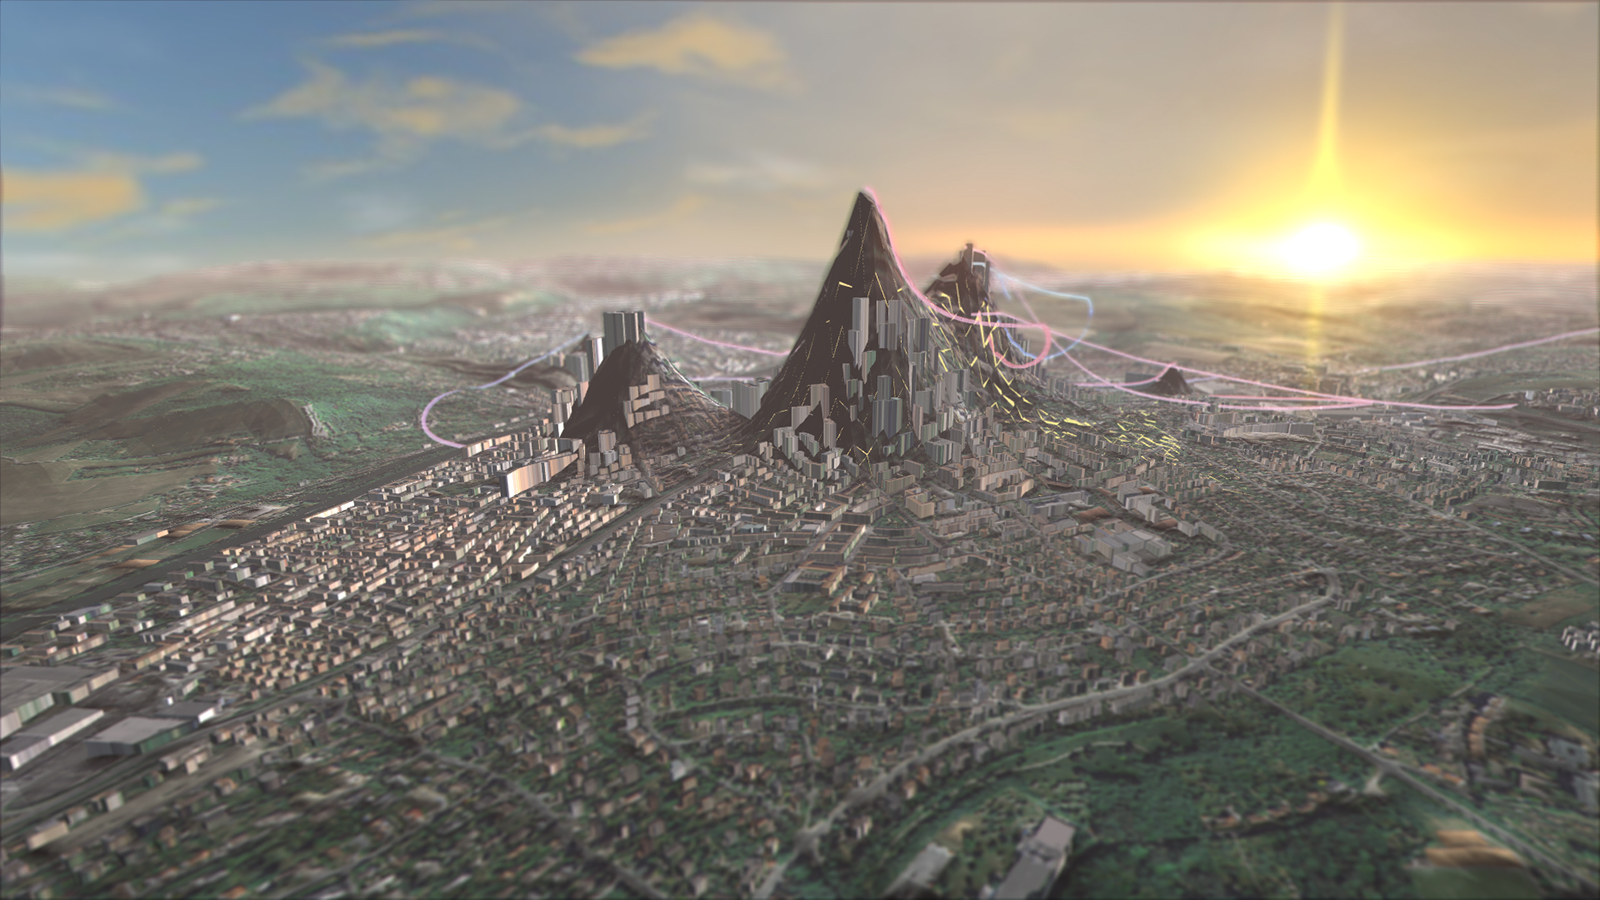
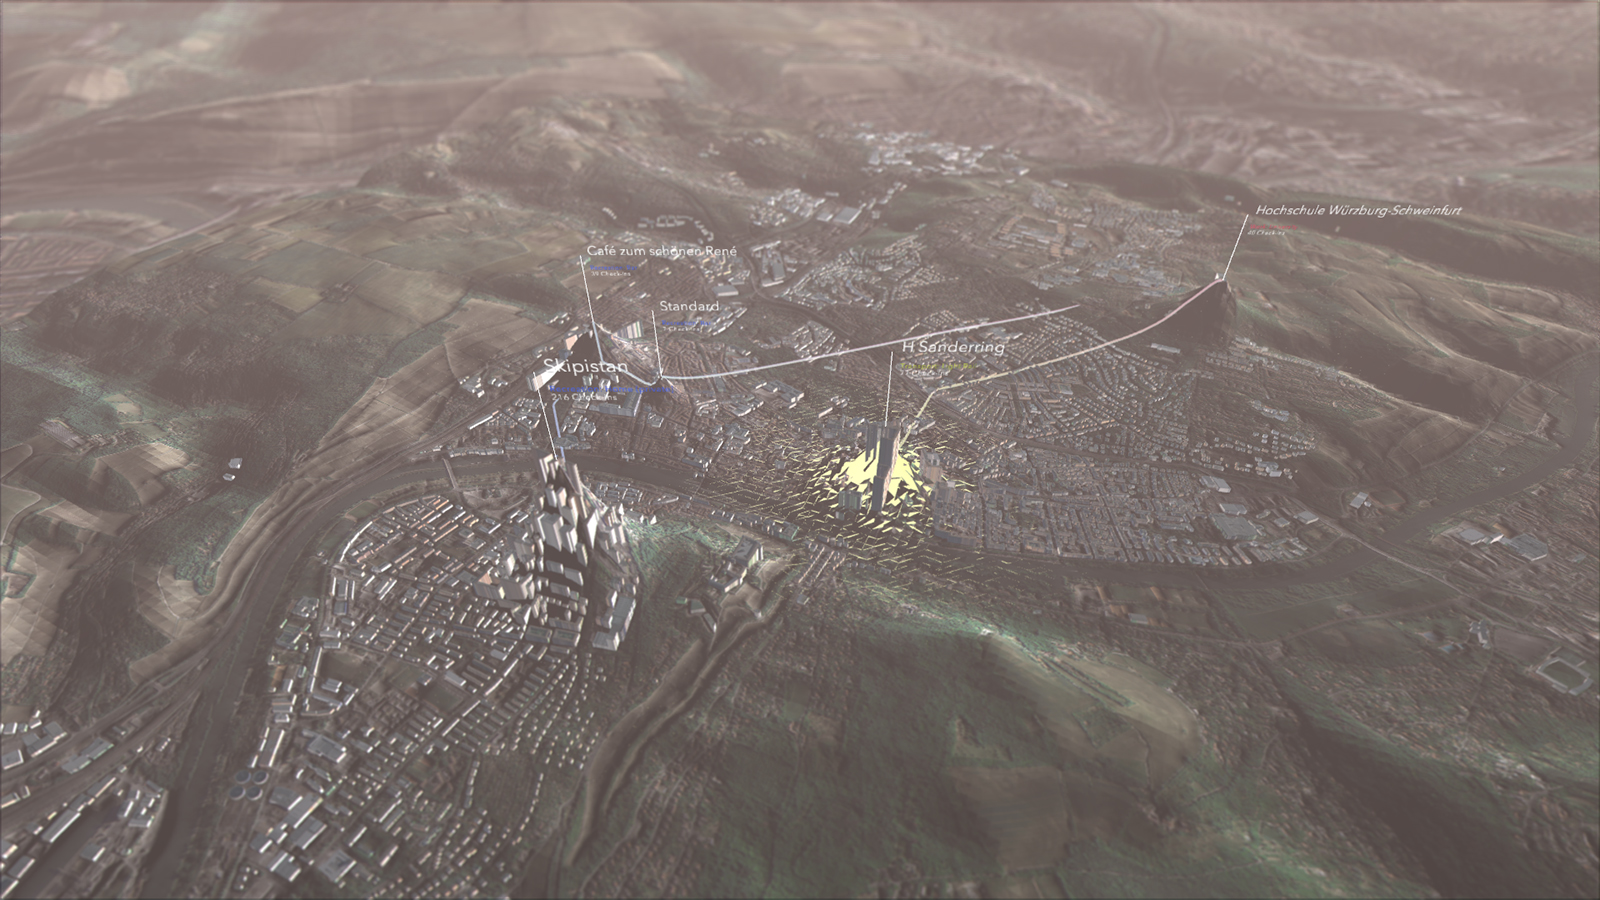
Some people want to show their job is important to them, so their work place grows a huge pile, filling its surroundings
with red tubes. Others want to show they are always on the go, so their landscape will fill with dozens of small hills
and links in all colours. Some residents are mostly focused on the center of their city, building huge but compact
structures; other spread out and integrate the city’s borders into the web.
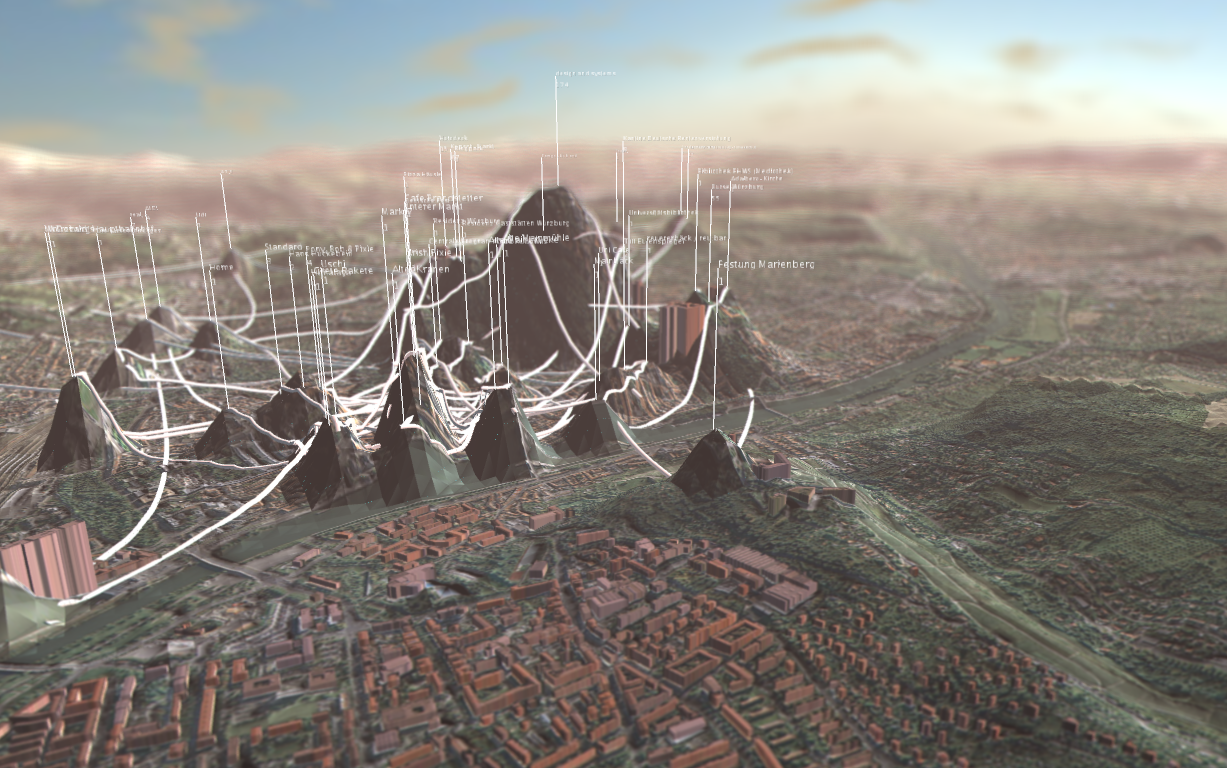
For diving deeper into the user data and being able to comprehend the categorizations, it is possible to switch on
labels for all the visited places. They show the name of the place, how many times the user checked in, and their
category.

Making of
»Generating utopia« was made using the Processing
programming environment. The initial function of the application was to serve as framework generating terrain from real
map data, being able to deform it based on various kinds of location data, and export it as 3d-model for rendering it
with 3d software. Later during the project I decided to make it a realtime application and do the rendering and image
output right from the Processing sketch as well.
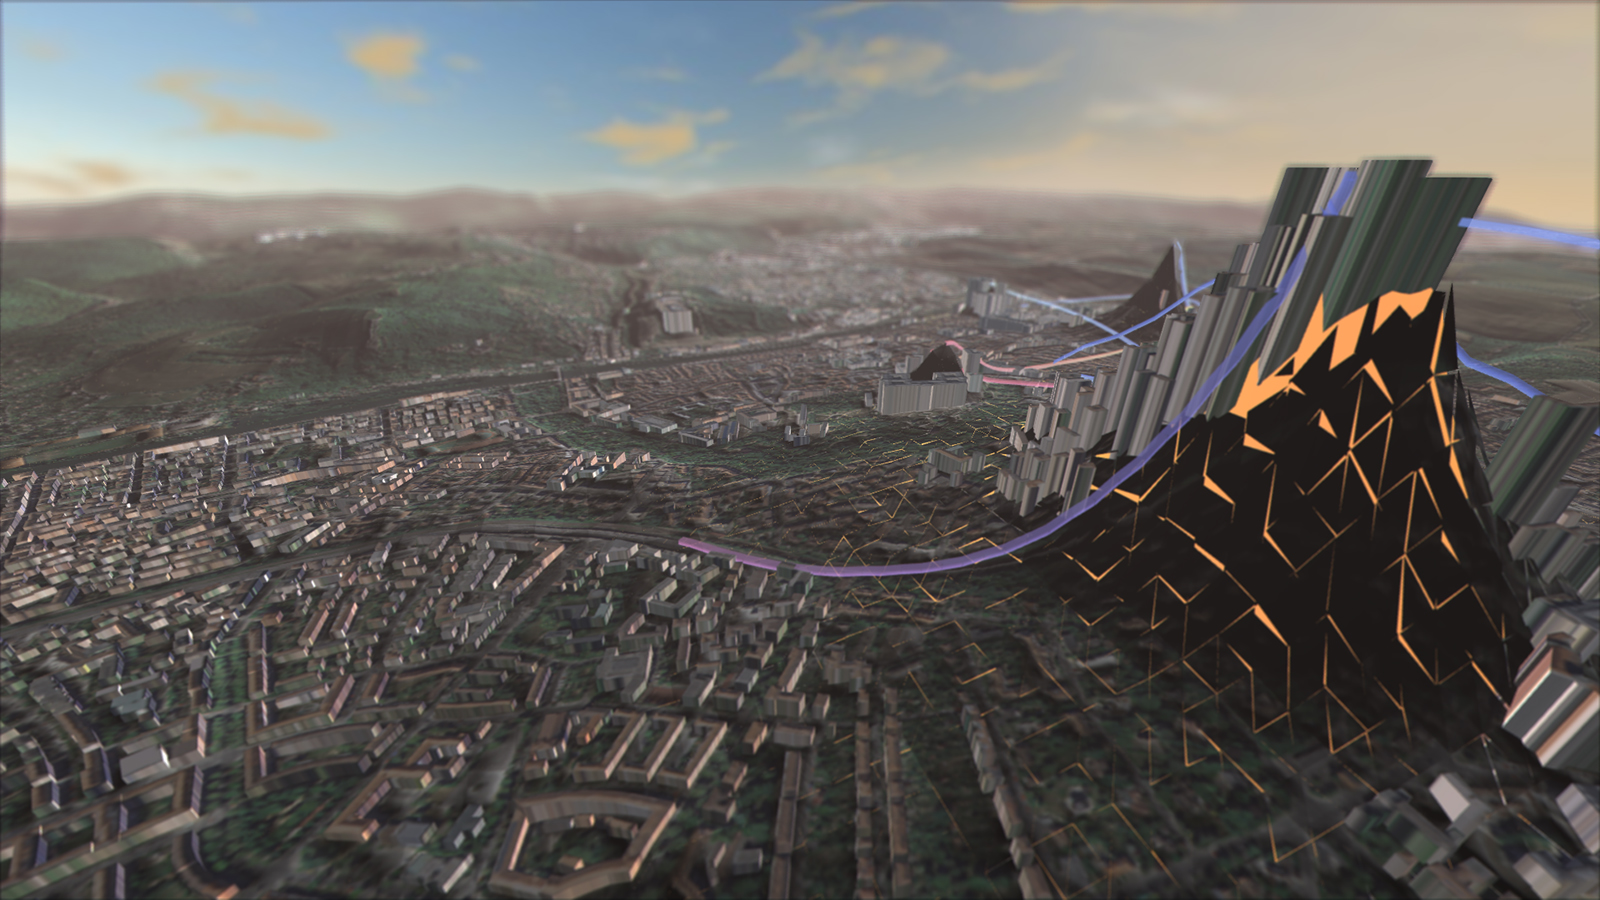
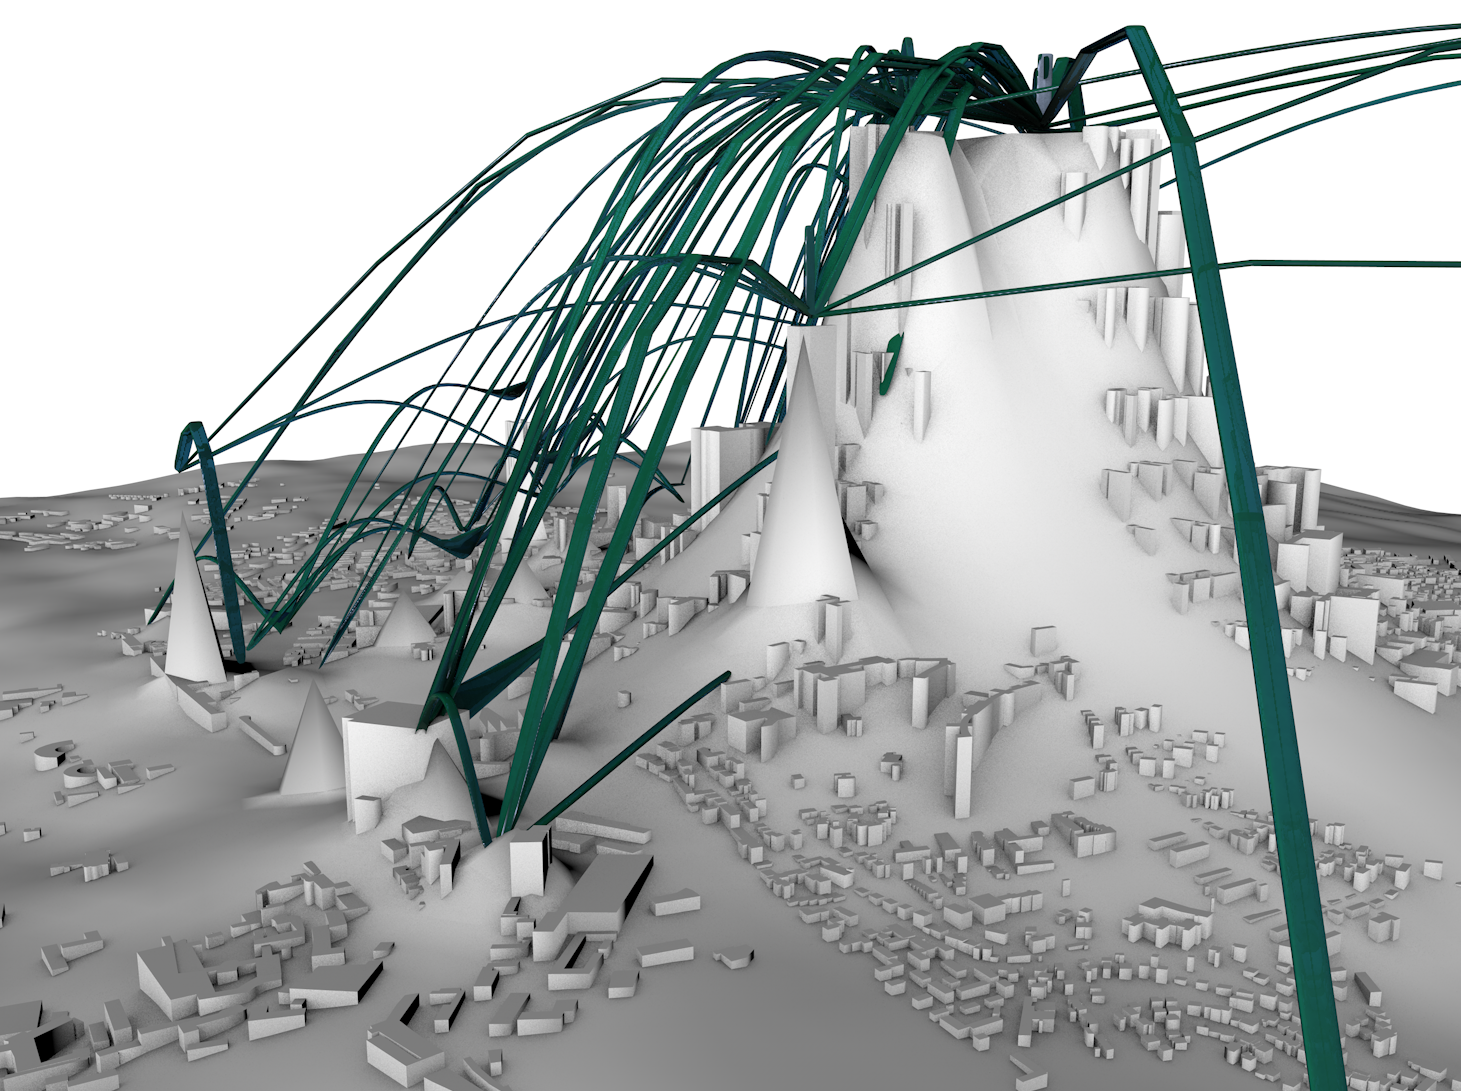
A challenging task was to keep the transforming terrain updated in realtime while providing as much detail and rendering
quality as possible. A heightmap keeps track of all the changes and transformations done to the terrain, while the
terrain is a dynamic GL model which is only updated at “changed” positions to keep the performance stable.
As for the lighting, using prerendered lightmaps for realtime-transforming terrain didn’t make sense – to achieve the
“sunsetty” mood a shader was created which changes the lighting depending on the viewing position, so there is always a
smooth balance between light and dark on objects.
The project makes intense use of the advanced OpenGL features implemented into Processing by Andres Colubri. Karsten
Schmidt’s library »toxiclibs« is used for some model calculations.
For the depth-of-field effect, a slightly adapted version of Martin Upitis’ GLSL dof shader was used.
Here’s some screenshots from the creating process:
Sorting and locating the data
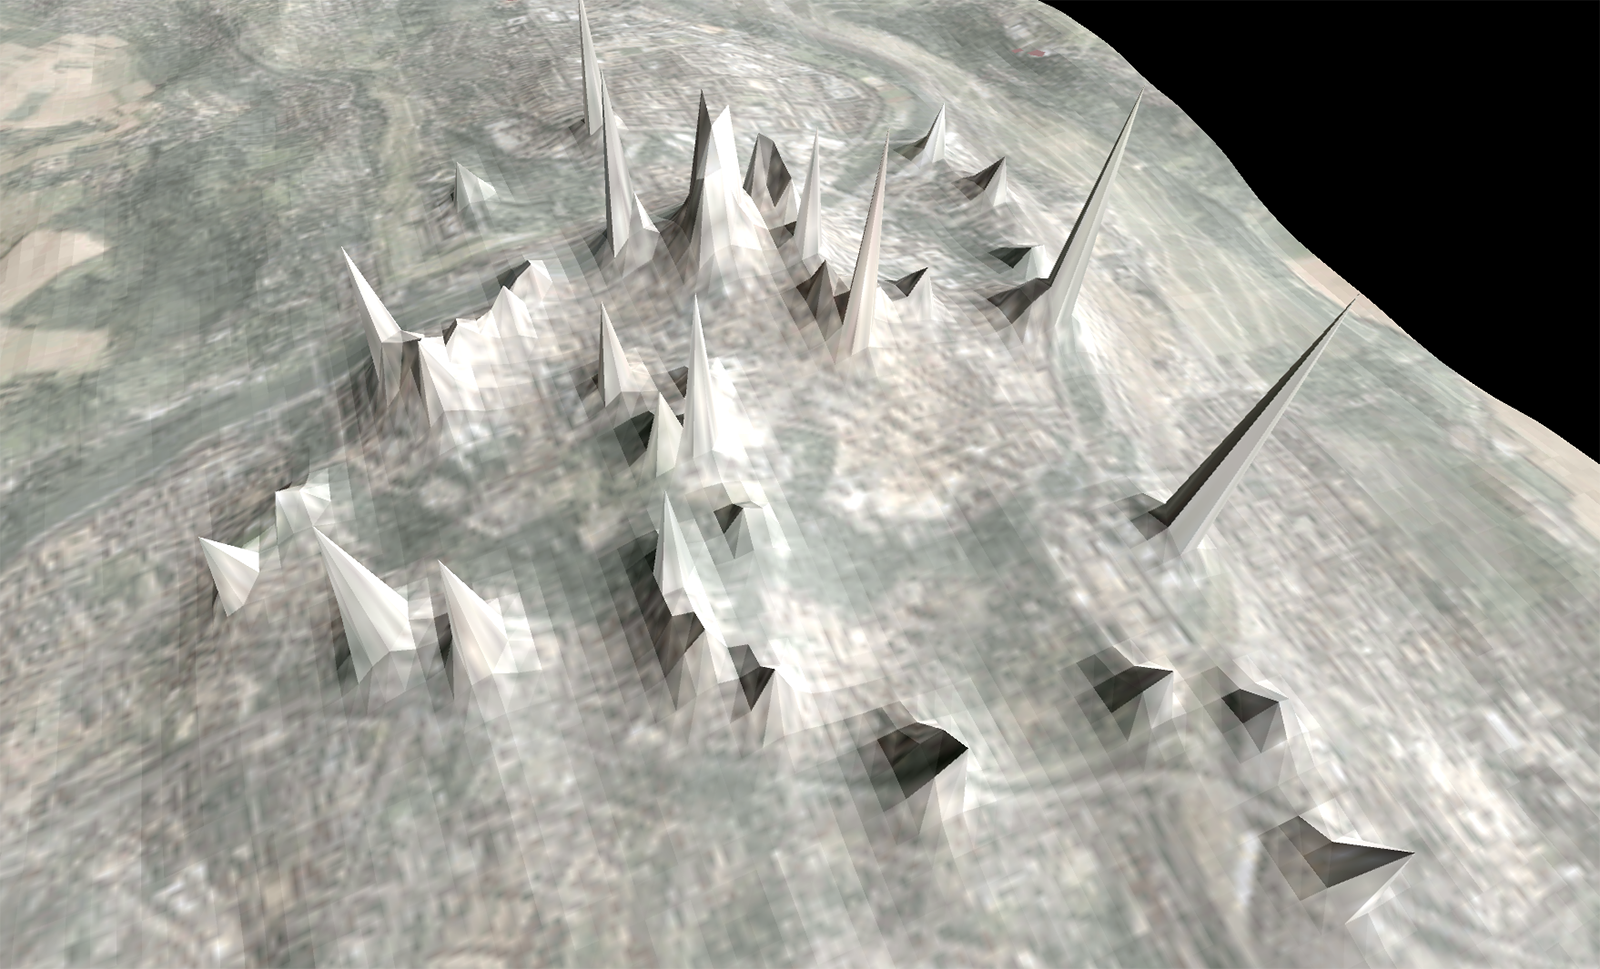
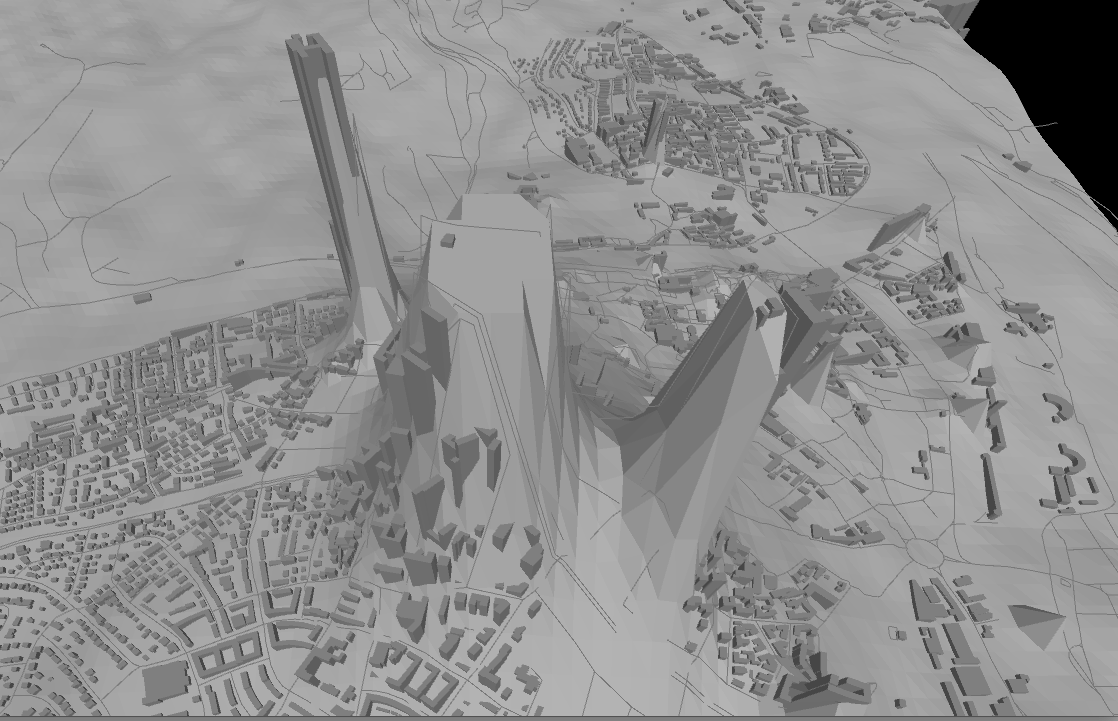
Conceptional renderings
Making the realtime app